Curation - Dependency Wheel Chart
Intended audience: END-USERS ANALYSTS DEVELOPERS ADMINISTRATORS
AO Platform: 4.3
Overview
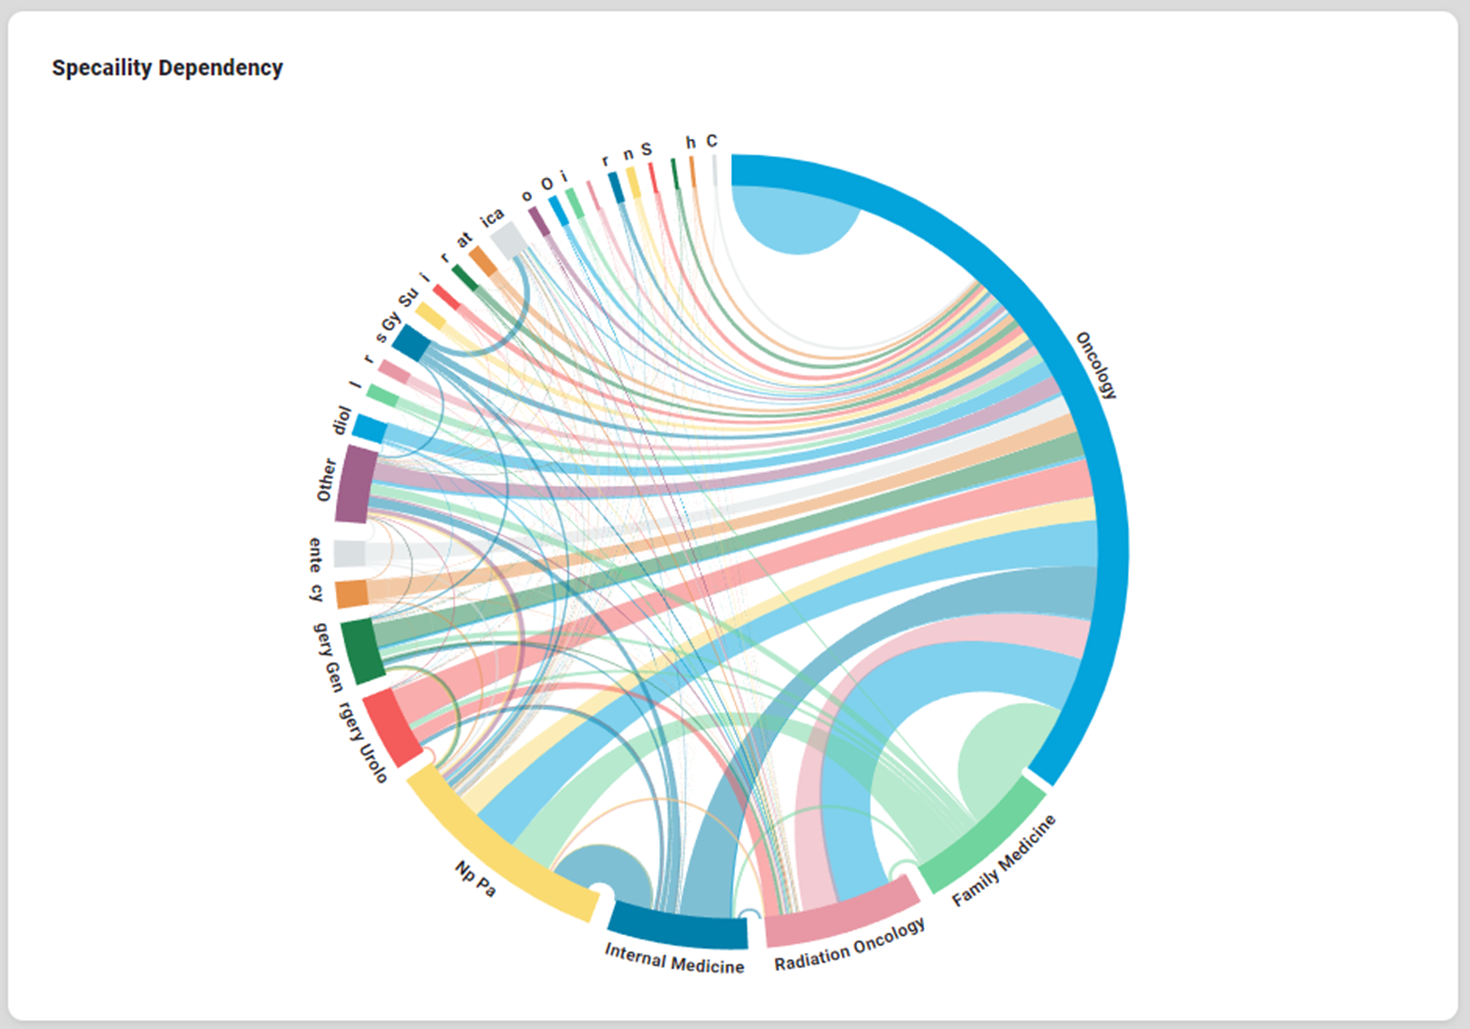
This topic provides an overview of a Dependency Wheel Chart. A Dependency Wheel Chart is a circular visualization displaying relationships or dependencies between different categories or elements. It is beneficial for analyzing flows, connections, or hierarchies in datasets.
Configuration of Dependency Wheel Chart
 | 
|
Properties
Label | UI Widget | Default | Description |
|---|---|---|---|
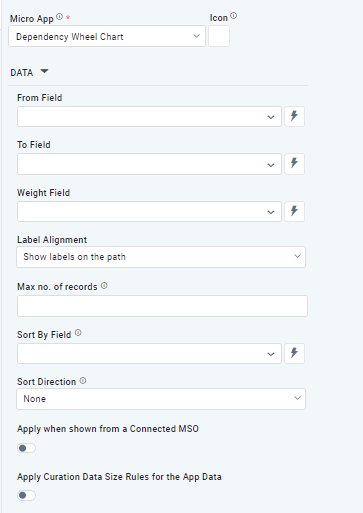
DATA | |||
From Field | Dropdown w/Expression option | The From field dropdown allows the user to select a specific column or attribute in the dataset that represents the source of a dependency or relationship. | |
To Field | Dropdown w/Expression option | The To field dropdown allows the user to select a specific column or attribute in the dataset that represents the endpoint of a dependency or relationship | |
Weight Field | Dropdown w/Expression option | The Weight Field dropdown allows the user to select a specific column or attribute in the dataset that quantifies the strength, intensity, or significance of the relationship between the From Field (source) and the To Field (endpoint). | |
Label Alignment | Dropdown | The Label Alignment allows the user to select an option from Do not show labels, Show labels, Labels on the path. | |
Max no. of records | Number Field | Option to set a Max number of records to be used by the Chart. | |
Sort By Field | Dropdown w/Expression option |
| The Sort By Field option allows users to select a field to sort the data and also provides the flexibility to define a custom expression for more advanced sorting criteria. |
Sort Direction | Dropdown | Option to set Sort order for data in the Chart to either Ascending or Descending. | |
Apply when shown from a Connected MSO | ON/OFF Toggle | The Apply When Shown from a Connected MSO ON/OFF Toggle determines whether the settings or actions are applied specifically when data is displayed through a connected MSO.
| |
Apply Curation Data Size Rules for the App Data | ON/OFF Toggle |
| If enabled, the Record Count rules will be applied. If the Record Count rules are not met, the series will not be shown. |
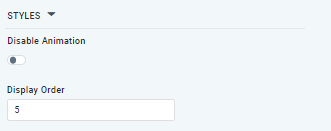
STYLES |
|
|
|
| ON/OFF Toggle |
| The Disable Animation toggle refers to turning off any animated transitions or effects that occur when the chart or visualization is rendered or updated. |
| Number Field |
| The Display Order determines the priority or order in which grouped or categorized data is presented. |
Examples of Curated Dependency Wheel Chart