Curation - Infographics
Intended audience: END-USERS ANALYSTS DEVELOPERS ADMINISTRATORS
AO Platform: 4.3
Overview
This section contains an overview of Infographics. Infographics refers to the process of designing and presenting data or information visually in a way that is both engaging and easy to understand. Infographics combine charts, graphs, icons, text, and other visual elements to convey complex information effectively.
Configuration of Infographics
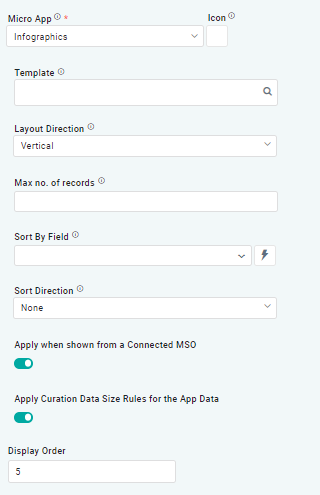 |
Properties
Label | UI Widget | Default | Description |
|---|---|---|---|
Template | Search Field | The Template search field allows the user to select from existing templates to be used for the Cue Card. | |
Layout Direction | Dropdown | The Layout Direction dropdown allows the user to specify the layout orientation for the visual component in the selected template, choosing between Vertical or Horizontal. | |
| Number Field |
| Option to set a Max number of records to be used by the Chart. |
| Dropdown w/Expression option |
| The Sort By Field option allows the user to select a field to sort the data and also provides the flexibility to define a custom expression for more advanced sorting criteria. |
| Dropdown |
| Option to set Sort order for data in the Chart to either Ascending or Descending. |
| ON/OFF Toggle |
| The Apply When Shown from a Connected MSO ON/OFF Toggle determines whether the settings or actions are applied specifically when data is displayed through a connected MSO.
|
| ON/OFF Toggle |
| If enabled, the Record Count rules will be applied. If the Record Count rules are not met, the series will not be shown. |
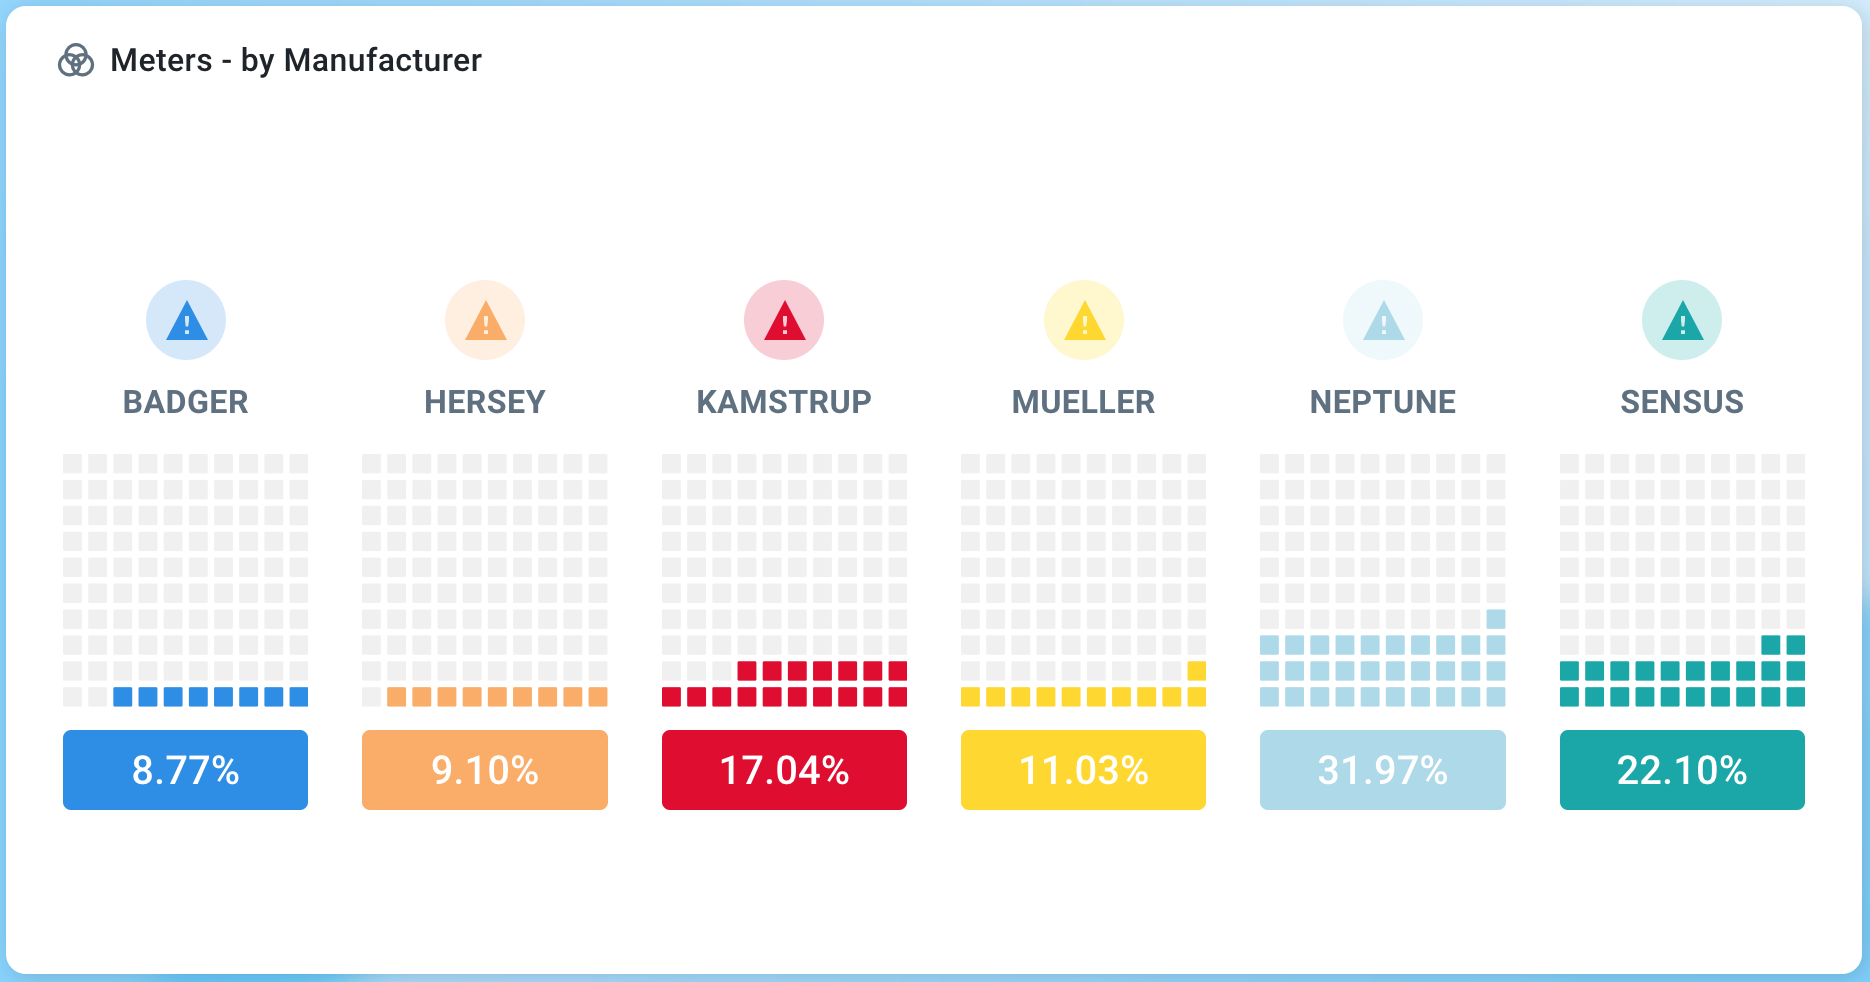
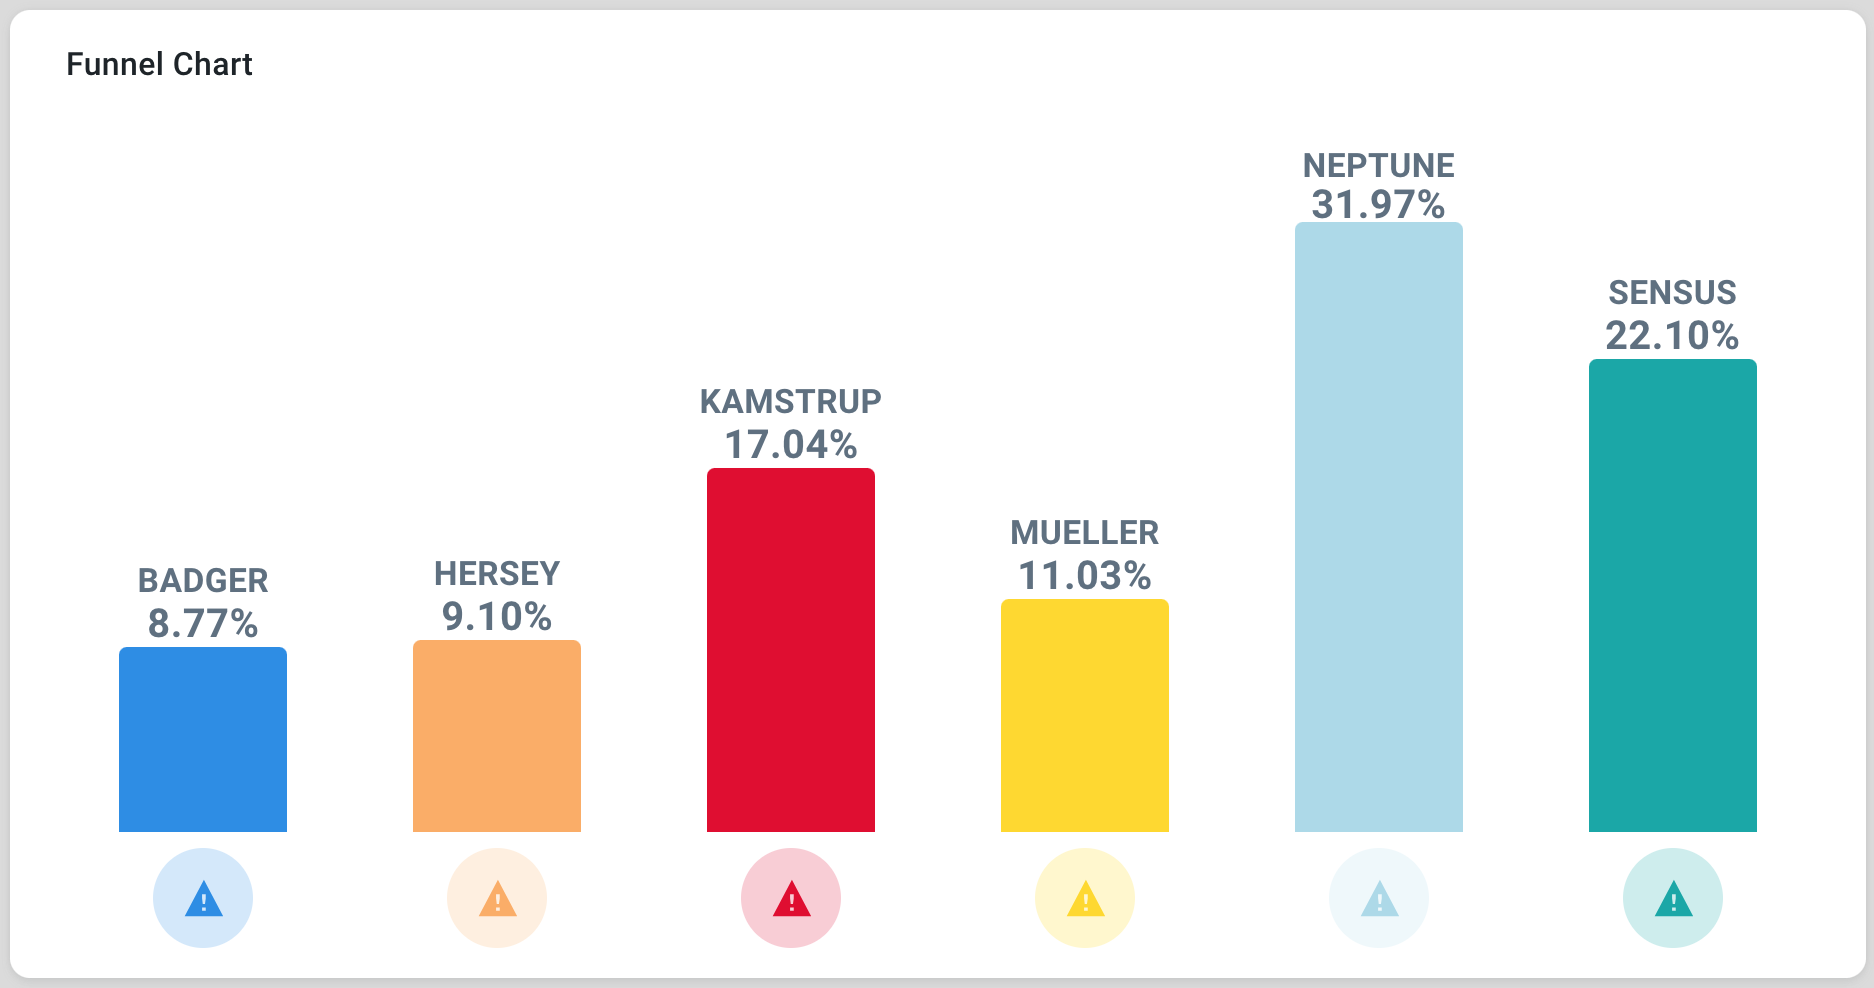
Examples of Curated Infographics