Ontology Viewer
Intended audience: END-USERS ANALYSTS DEVELOPERS
AO Platform: 4.3
Overview
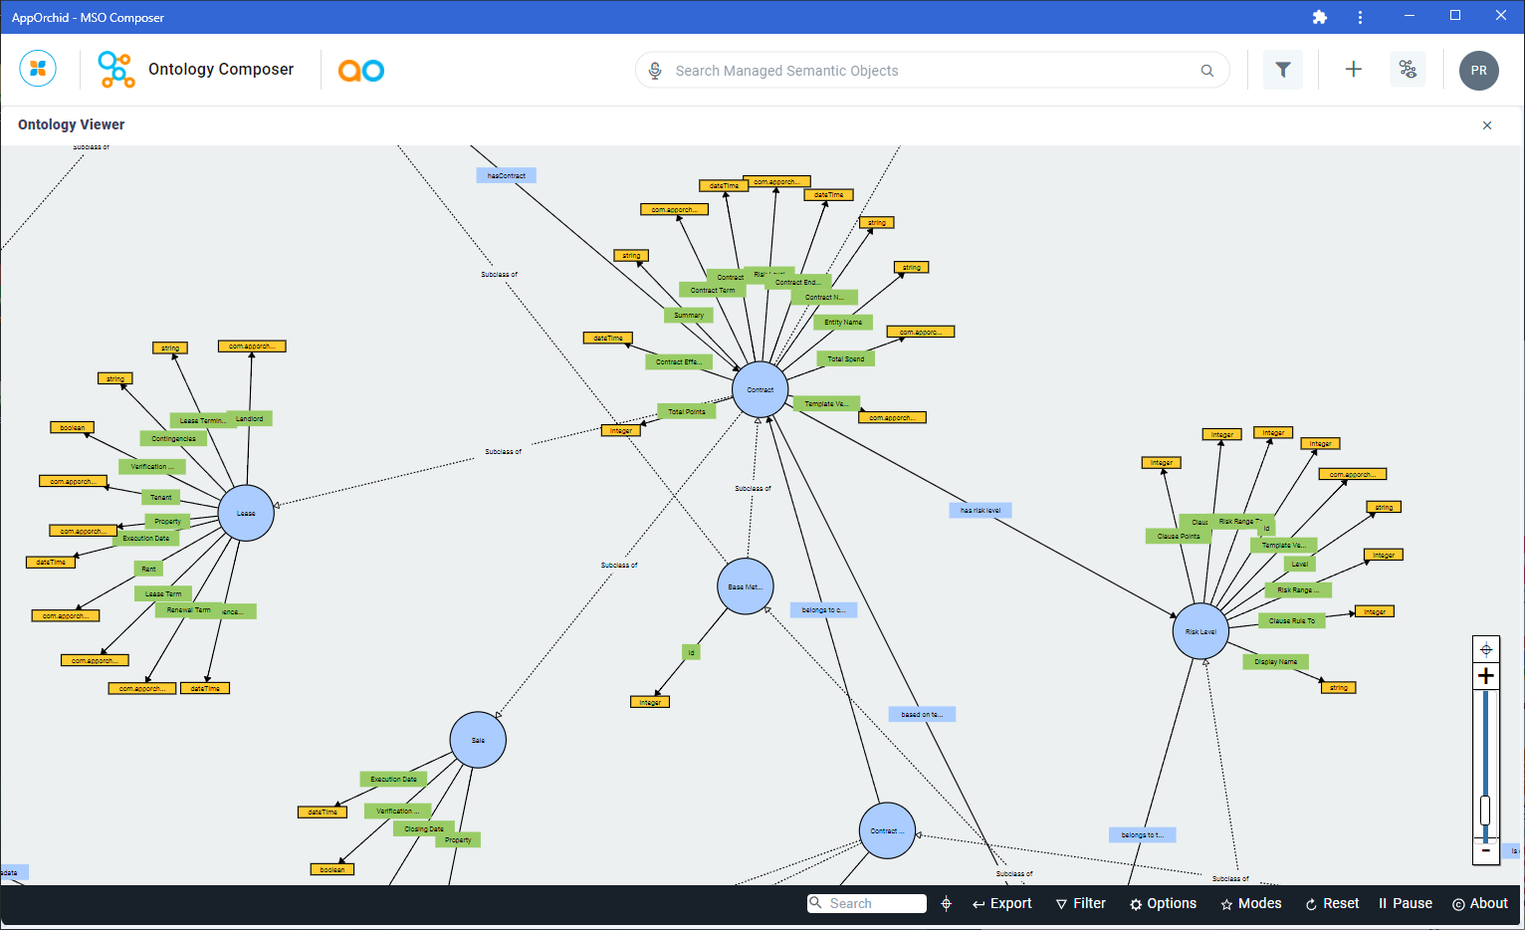
The Ontology Viewer is a way to view the individual MSOs created in the Ontology Composer and their properties as well as their relationships to each other.
User Actions
Filter (domain) - allows user to select all domains (default) or a specific ontology domain
Zoom in/out - allows user to quickly navigate the Ontology Viewer canvas - zooming into details about individual MSOs or zooming out for the birdseye view
Search - allows user to search for any type of label relating to either MSO Names, Properties, Datatypes and Relationships
Export - allows user to export the currently viewed ontology to different formats, including: JSON and SVG
Filter (elements) - allows user to filter on different elements of the ontology, including: Datatype properties, Object properties, Solitary subclasses, Class disjointness, Set operators, and Degree of collapsing
Options - allows user to configure settings for the Ontology Viewer canvas, including: Zoom controls, Class distance, Datatype distance, Dyunamic label width, Max label width, Node scaling, Compact notation, and Color externals
Modes - allows user to set modes for interacting with the elements on the canvas, including: Editing (Experimental) and Pick & pin. Pick & pin is useful being able to pin certain elements to their current location on canvas.
Reset - allows user to reset the canvas
Pause/Resume - allows user to pause the auto adjustment of the elements on the canvas. Once Paused, user can moved around on the canvas and even move any element without affecting any other elements. Select Resume to allow the canvas to be re-adjusted for “optimal alignment” of all elements
Legend for Ontology Viewer components
Visual Component | Description |
|---|---|
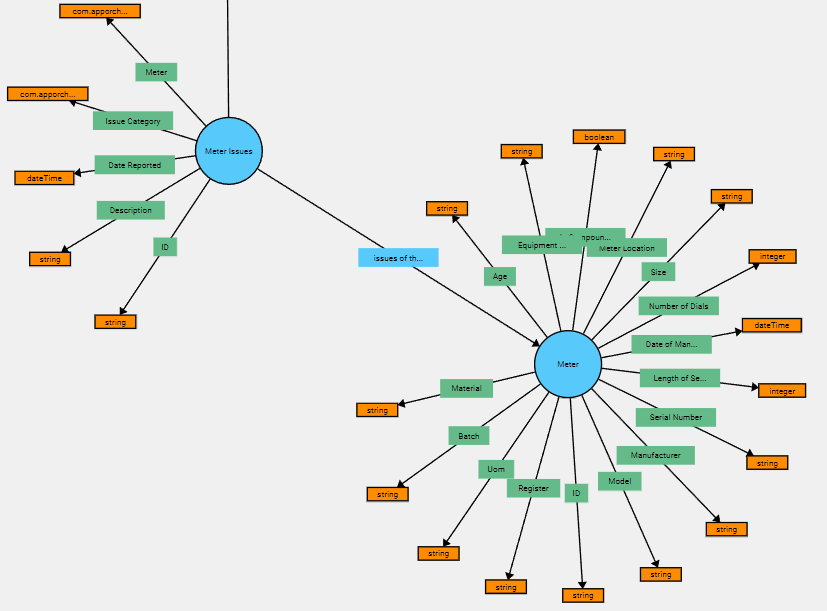 |  Blue circles are nodes in the ontology. Nodes mostly have properties and have connections to other nodes (relationships), but they can also exist in an ontology without properties and/or without direct relationships.  Blue labels on solid lines describe a direct connected relationship between two nodes. A relationship can be seen between the Meter and Meter Issues nodes in the example on the left. Dotted lines describe “subclass” relationships between nodes.  Green labels are node properties (fields). Examples include ID, Manufacturer, Material, Age, Serial Number, etc… for the Meter node, and ID, Issue Category, Date Reported, Description, etc… for the Meter Issues node.  Orange labels are data types for each of the node properties. Examples include integer, string, boolean, etc… |
Video
If new MSOs have been created, or existing MSOs edited, then it’s important to go to the Ontology page and select Create/Update Graph in the Actions menu for the Ontology being viewed. See Creating an Ontology.
Simply close the Ontology Viewer to go back to the MSO overview.