Curation - Funnel Chart
Intended audience: END-USERS ANALYSTS DEVELOPERS ADMINISTRATORS
AO Platform: 4.3
Overview
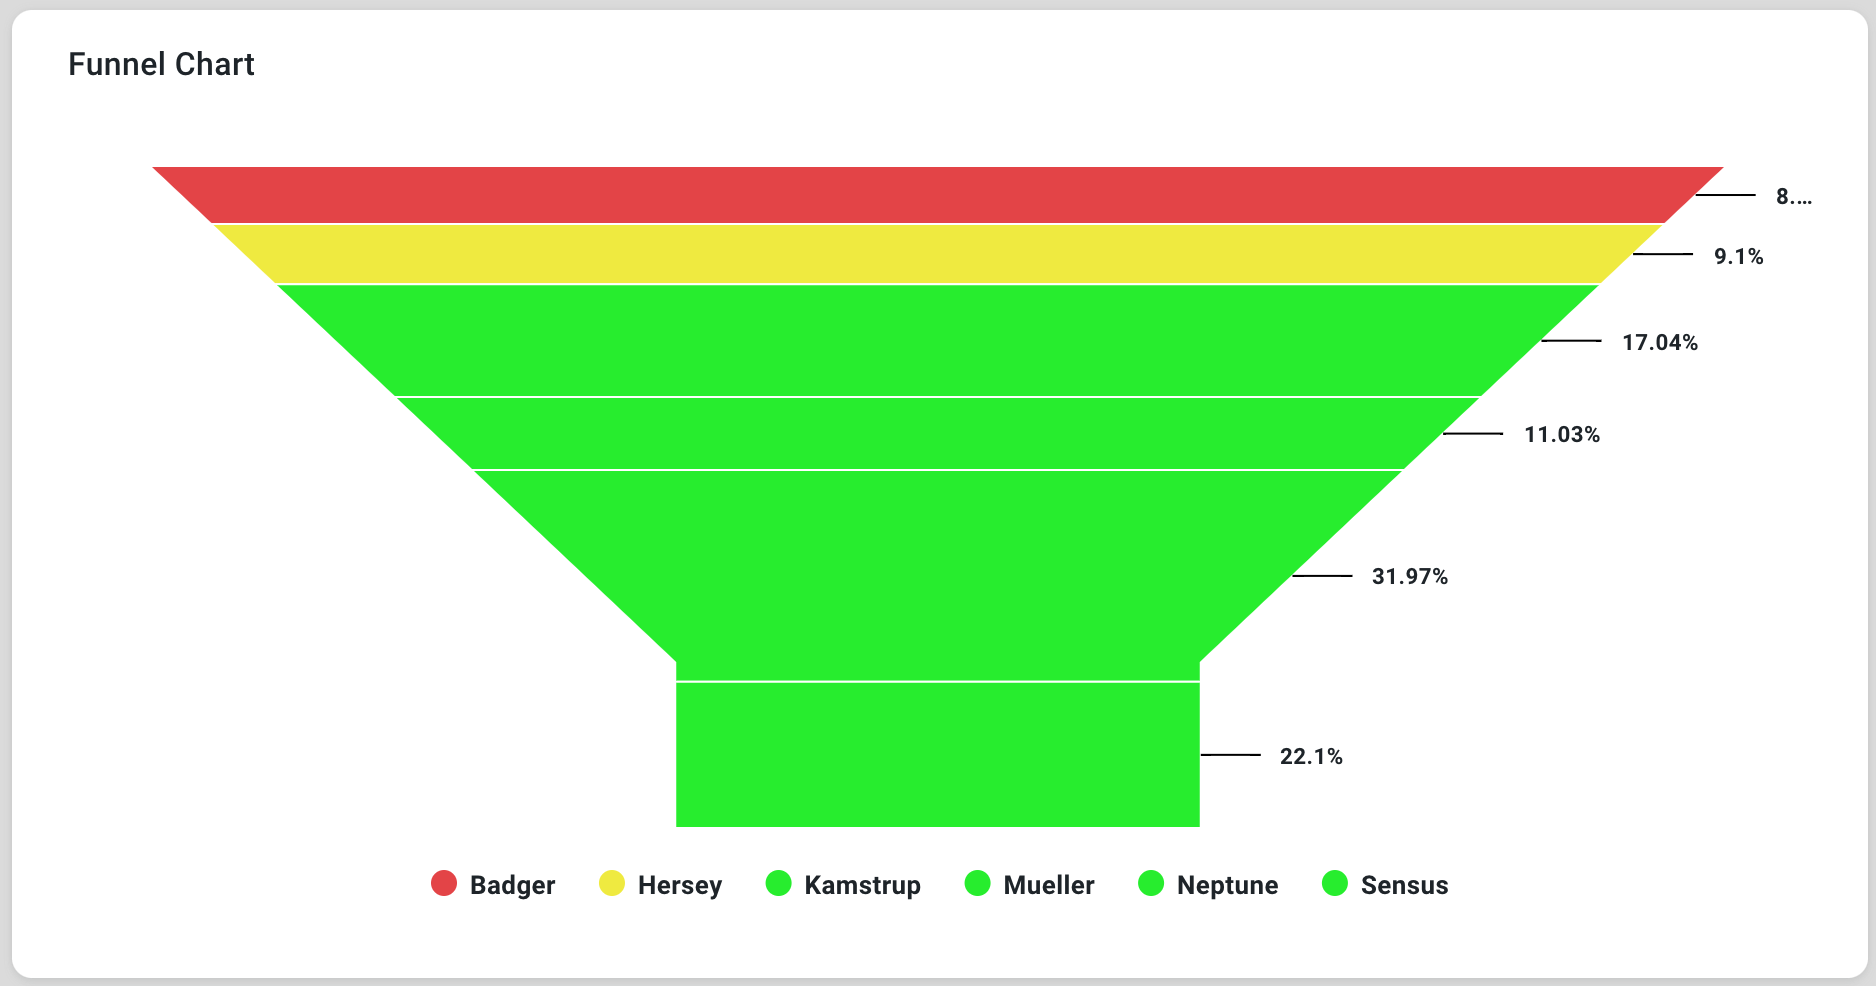
This section provides an overview of a Funnel Chart. A Funnel Chart is a visualization that allows user to display data that flows through sequential stages in a process, illustrating how values decrease progressively at each stage.
Configuration of Funnel Chart
 |     |
Properties
Label | UI Widget | Default | Description |
|---|---|---|---|
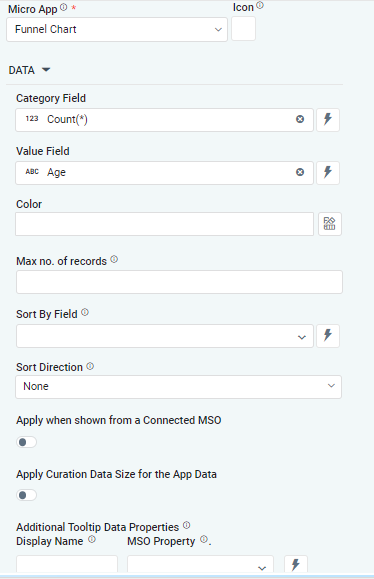
DATA | |||
| Dropdown w/Expression option | The Category Field dropdown allows the user to select the category. | |
| Dropdown w/Expression option | The Value Field dropdown allows the user to select a value. | |
| Text Field w/Color Palette option |
| The Colors allows the user to select which color to use for the Funnel of the chart. See Curation - Field Properties - Data Styles | Selection-of-Color. |
| Number Field |
| Option to set a Max number of records to be used by the Chart. |
| Dropdown w/Expression option |
| The Sort By Field option allows the user to select a field to sort the data and also provides the flexibility to define a custom expression for more advanced sorting criteria. |
| Dropdown |
| Option to set Sort order for data in the Chart to either Ascending or Descending. |
| ON/OFF Toggle |
| The Apply When Shown from a Connected MSO ON/OFF Toggle determines whether the settings or actions are applied specifically when data is displayed through a connected MSO.
|
| ON/OFF Toggle |
| If enabled, the Record Count rules will be applied. The series will not be shown if the Record Count rules are not met. |
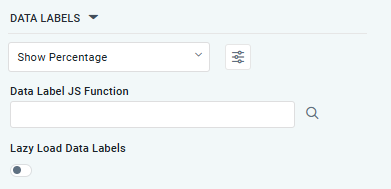
DATA LABELS |
|
|
|
| Dropdown w/Additional Properties option |
| Optional Additional Properties - expressed as a Key/Value pair. |
… Additional Properties |
|
| Optional Additional Properties - expressed as a Key/Value pair. |
| Text Field w/Search |
| The Data Label JS function allows the user to search for and define JavaScript functions that control the display or behavior of data labels in a chart. |
| ON/OFF Toggle |
| If enabled, in the forest chart curation controls whether data labels are loaded gradually as the chart is interacted. |
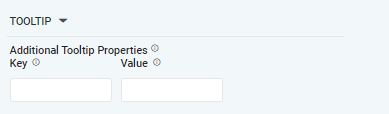
TOOLTIP |
|
|
|
| Key / Value - Text Fields |
| Optional Additional Tooltip Properties - expressed as a Key/Value pair. |
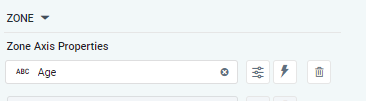
ZONE |
|
|
|
| Dropdown w/Additional Properties and Expression options |
| The Zone Axis Properties dropdown allows the user to customize the properties of the Zone Axis in an area chart, |
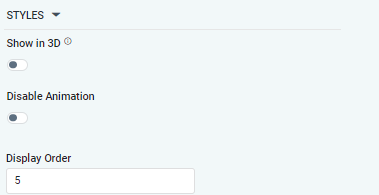
STYLES |
|
|
|
| ON/OFF Toggle |
| If enabled, shows the funnel Chart a 3D chart shows the Column Chart with some depth and at a rotated angle. |
| ON/OFF Toggle |
| The Disable Animation toggle refers to turning off any animated transitions or effects that occur when the chart or visualization is rendered or updated. |
Examples of Curated Funnel Chart