Curation - Serverside Pivot
Intended audience: END-USERS ANALYSTS DEVELOPERS ADMINISTRATORS
AO Platform: 4.3
Overview
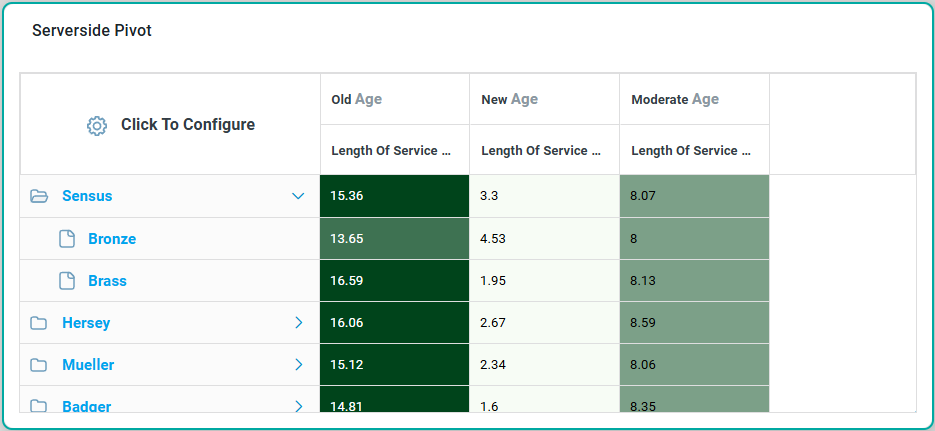
This section provides an overview of a Serverside Pivot for a Curation Micro Application. A Server-Side Pivot is a data visualization and analysis tool that processes and aggregates data on the server before delivering it to the client application.
Configuration of Serverside Pivot
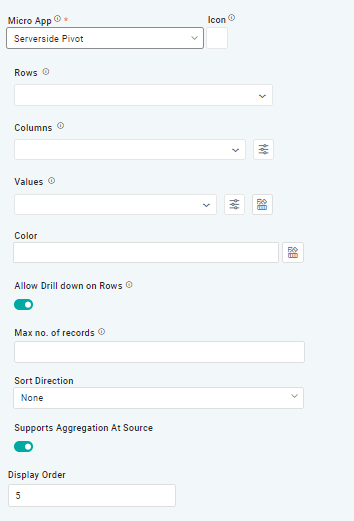 |
Properties
Label | Description | ||
|---|---|---|---|
| Dropdown | The Rows dropdown allows user to select one or more field properties to represent the hierarchical structure of the rows in the pivot table. | |
| Dropdown | The Column dropdown allows user to select one or more field properties to represent the hierarchical structure of the columns in the pivot table. | |
| Dropdown | The Value dropdown allows user to select one or more aggregated field properties (count, sum, avg, min, max, etc.) which will be shown for each row/column value. | |
| Text Field w/Color Palette option |
| The Colors allows user to select which color to use for the Column of the series. See Curation - Field Properties - Data Styles | Selection-of-Color. |
| ON/OFF Toggle | Enable | If enabled, allows user to drill down on rows. |
| Number Field |
| Option to set a Max number of records to be used by the Chart. |
| Dropdown |
| Option to set Sort order for data in the Chart to either Ascending or Descending. |
| ON/OFF Toggle | Enable | If enabled, the system is configured to perform aggregation operations (such as sum, average, count, min, max, etc.) directly at the data source, such as a database or API, before sending the results to the micro-app. |
| Number Field |
| The Display Order determines the priority or order in which grouped or categorized data is presented. |
Examples of Curated Serverside Pivot