Curation - Temporal Aggregation Chart
Intended audience: END-USERS ANALYSTS DEVELOPERS ADMINISTRATORS
AO Platform: 4.3
Overview
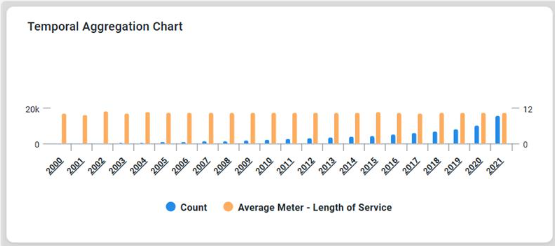
This section provides an overview of a Temporal Aggregation Chart. The Temporal Aggregation Chart is a powerful visualization tool for analyzing time-based trends and patterns. Its flexibility and interactivity make it suitable for a wide range of use cases, from business analytics to scientific research.
Configuration of Temporal Aggregation Chart
  |    |
Properties
Label | Description | ||
|---|---|---|---|
DATA |
|
|
|
|
|
|
|
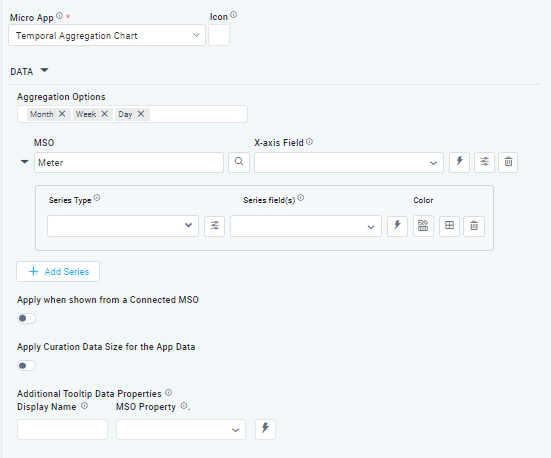
| Dropdown w/Expression option |
| The X-axis Field allows the user to select the MSO Field Property to represent the X-axis values in the Chart. |
| Dropdown w/Expression option |
| The Series Type Field dropdown in area chart curation allows users to specify a field that determines the type of series displayed in the chart. |
| Dropdown w/Additional Properties and Expression options |
| The Series Field allows the user to select an MSO Field Property to represent the Series Field. |
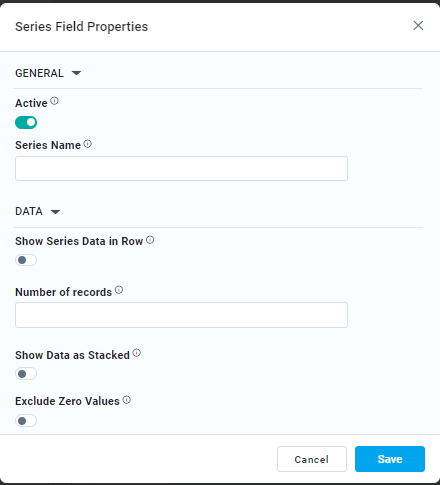
… Exclude Zero Values | ON/OFF Toggle |
| If enabled, zero values will be excluded. By default, this setting is disabled. |
Additional Properties | Key / Value - Text Fields |
| Optional Additional Properties - expressed as a Key/Value pair. |
| Text Field w/Color Palette option |
| The Colors allows the user to select which color to use for the multi XY series. See Curation - Field Properties - Data Styles | Selection-of-Color. |
Delete Series |
|
| The Delete a series in a chart, allows the user to delete the associated data series from the chart configuration |
| ON/OFF Toggle |
| The Apply When Shown from a Connected MSO ON/OFF Toggle determines whether the settings or actions are applied specifically when data is displayed through a connected MSO.
|
| ON/OFF Toggle |
| If enabled, the Record Count rules will be applied. If the Record Count rules are not met, the series will not be shown. |
| Display Name - Text Field MSO Property - Dropdown |
| The Additional Tooltip Data Properties allows the user to select one or more MSO Field Properties to display their values in the tooltip when the user hovers over a data point. |
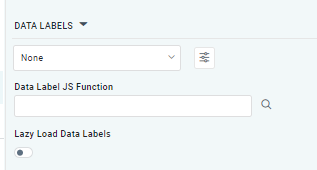
DATA LABELS |
|
|
|
| Dropdown w/Additional Properties option |
| Optional Additional Properties - expressed as a Key/Value pair. |
… Additional Properties |
|
| Optional Additional Properties - expressed as a Key/Value pair. |
| Text Field w/Search |
| The Data Label JS function allows users to search for and define JavaScript functions that control the display or behavior of data labels in a chart. |
| ON/OFF Toggle |
| If enabled, in the error line chart curation controls whether data labels are loaded gradually as the chart is interacted. |
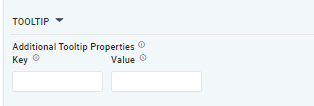
TOOLTIP |
|
|
|
| Key / Value - Text Fields |
| Optional Additional Tooltip Properties - expressed as a Key/Value pair. |
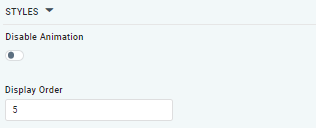
| Number Field |
| The Display Order determines the priority or order in which grouped or categorized data is presented. |
Examples of Curated Temporal Aggregation Chart