Curation - Trend Cue Card
Intended audience: END-USERS ANALYSTS DEVELOPERS ADMINISTRATORS
AO Platform: 4.3
Overview
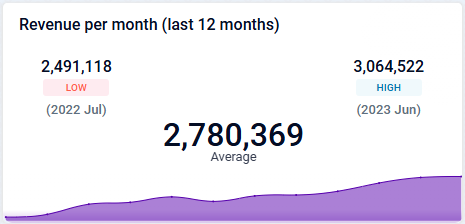
This section provides an overview of a Trend Cue Card for a Curation Micro Application. Trend Cue Card is a powerful visualization tool designed to highlight key trends, patterns, and performance metrics over time.
Configuration of Trend Cue Card

|
Properties
Label | UI Widget | Default | Description |
|---|---|---|---|
| Dropdown w/Expression option |
| The Time Field allows users to specify a column or attribute in the dataset that holds temporal information, such as dates or timestamps. This field is used to map and plot data on the heatmap in a calendar-style layout. |
| Dropdown w/Expression option |
| The Value Field allows users to specify a column or attribute in the dataset that contains numerical or quantitative data. These values determine the intensity or color gradient of each cell in the calendar heatmap. |
| Dropdown | The Duration field allows user to select defined time range, such as daily, weekly, or monthly intervals. | |
| Dropdown | The Trend Line Duration field allows user to select defined time range, such as daily, weekly, or monthly intervals. | |
| Dropdown | The Show changes As dropdown field allows user to select Percentage or Value from dropdown. | |
| The Value Formatter field allows user to select JS Functions. | ||
| The Trend End Date in a Duration Trend Cue Card refers to the final date of the time range over which the trend is analyzed and displayed. | ||
| Text Field w/Color Palette option |
| The Trend Line Color allows user to select which color to use for the series. See Curation - Field Properties - Data Styles | Selection-of-Color. |
| ON/OFF Toggle | Disabled | If enabled, the Consider Negative Value as Good option specifies the negative values in the dataset be interpreted positively in the context of performance or outcomes. |
| ON/OFF Toggle | Enable | If enabled, the Consider Relative Time Frame setting in a Trend Cue Card ensures that trends are analyzed and displayed for a dynamically adjustable time frame based on relative periods. |
| ON/OFF Toggle |
| The Apply When Shown from a Connected MSO ON/OFF Toggle determines whether the settings or actions are applied specifically when data is displayed through a connected MSO.
|
| Number Field |
| The Display Order determines the priority or order in which grouped or categorized data is presented. |
Examples of Curated Trend Cue Card