
Intended audience: Developers administrators
AO Platform: 5.0
Overview
This topic provides insight into how to access the AO Platform Semantic Layer from Microsoft Excel using an OData Connection.
AO Platform server exposes the same semantic data (ontologies, MSOs, properties, and relationships) available via JDBC/Avatica as an OData v4 read-only service. External reporting tools such as Microsoft Excel can connect to this service and query data over MSOs (Managed Semantic Objects) without using a SQL driver.
For full details, see the topics for Using OData Connection from Microsoft Power BI.
Video Demo in Microsoft Excel
Connecting to OData Data Sources in Excel
Get Data
-
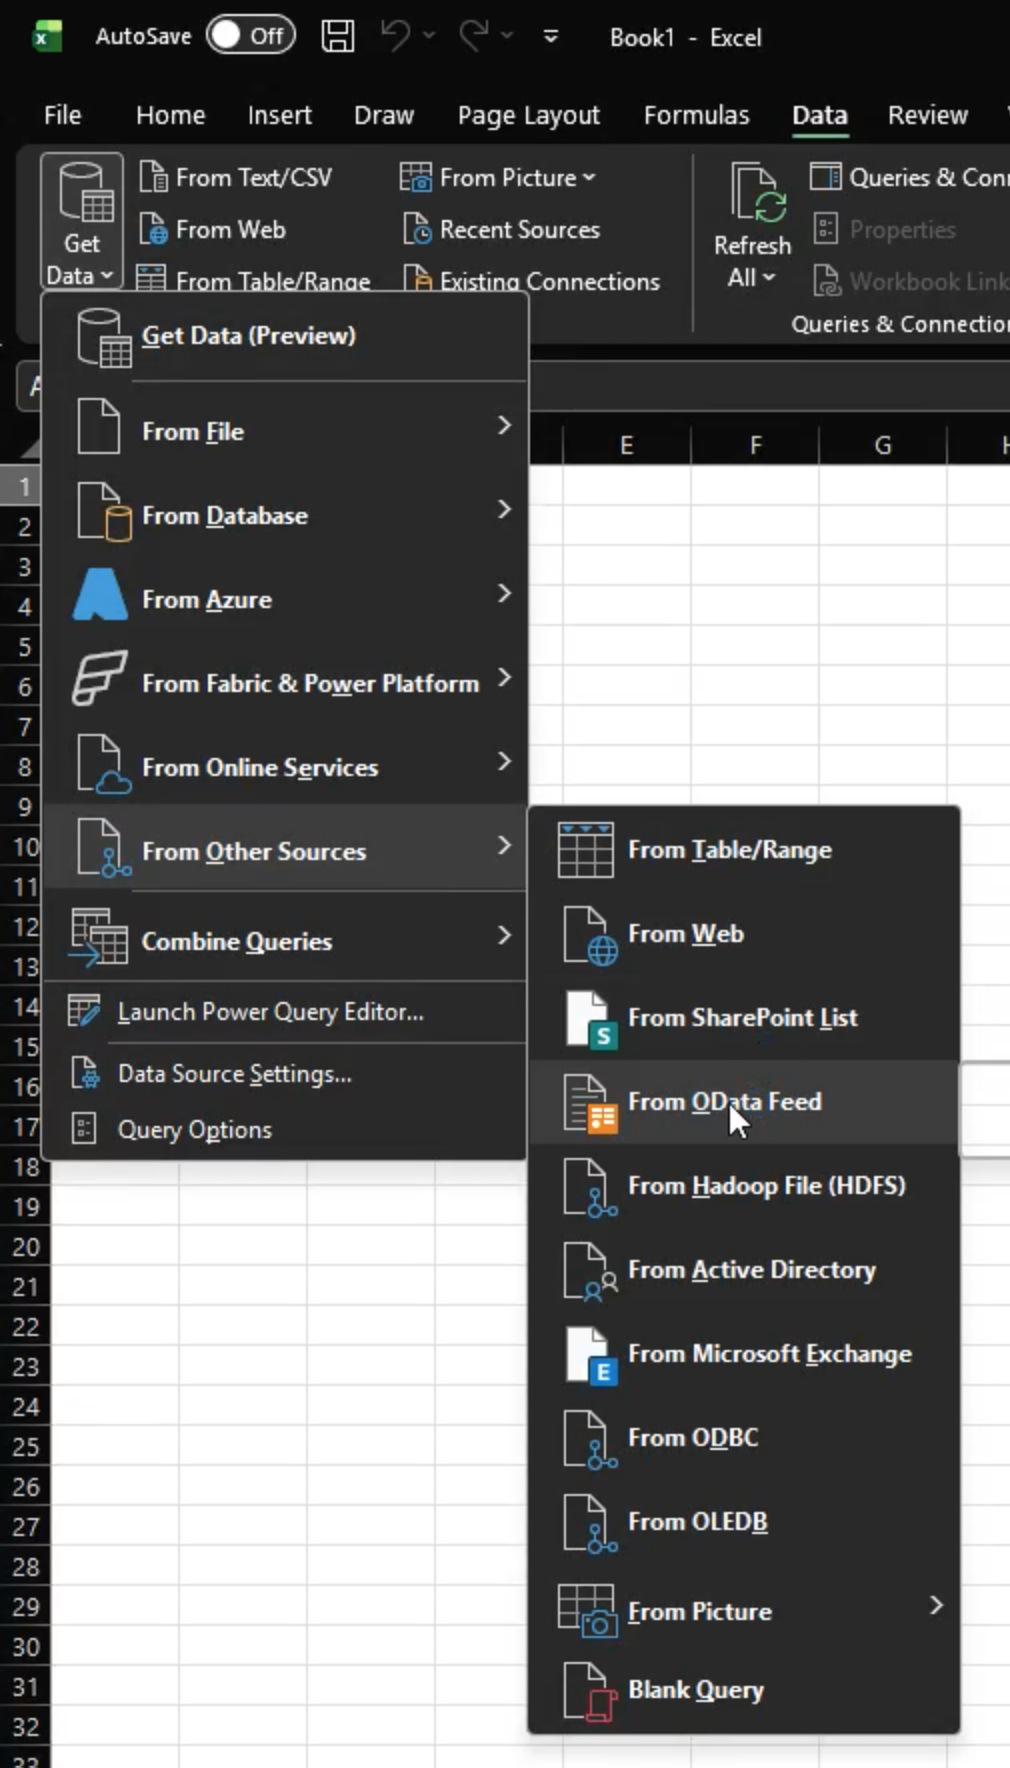
To access the OData menu option, go to the Data tab in Excel, then click the Get Data icon in the ribbon.
-
From the dropdown, go to From Other Sources, and then select the From OData Feed in the submenu.
-
Note: Some Excel versions have an option called Get Data (Power Query). If so, follow the Get Data (Power Query), then a dialog opens from which an OData option will be available.
-
Connection String to an OData Data Source
-
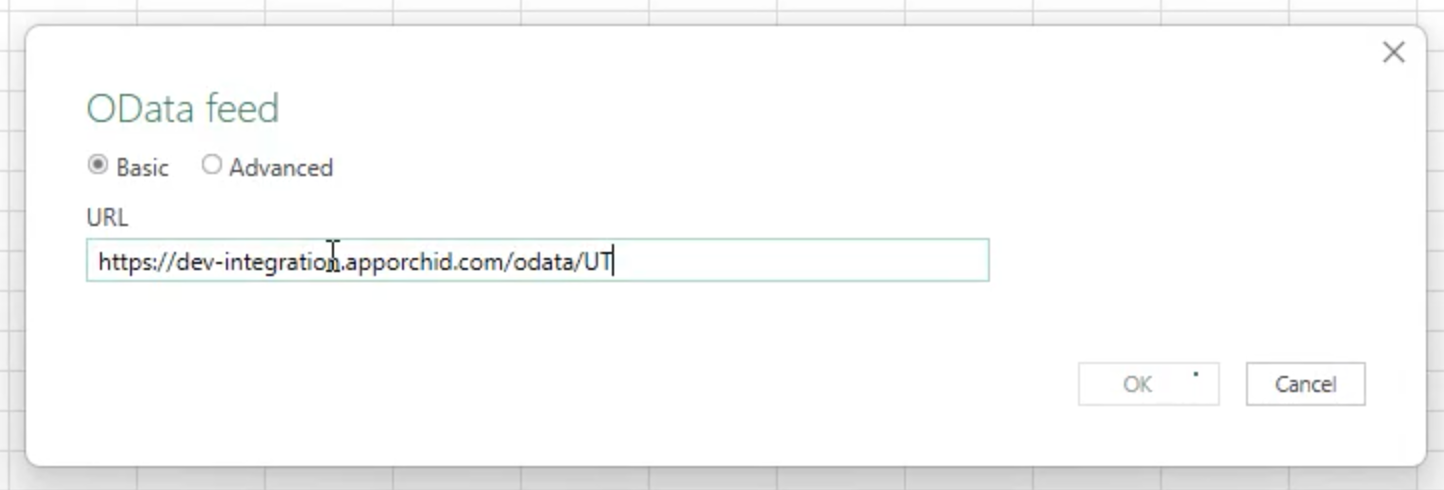
The OData feed dialog opens.
-
Select the Basic radio button, then enter the URL of the AO Platform server.
-
URL syntax: https://[domain-name]/odata/[ontology-id]
-
-
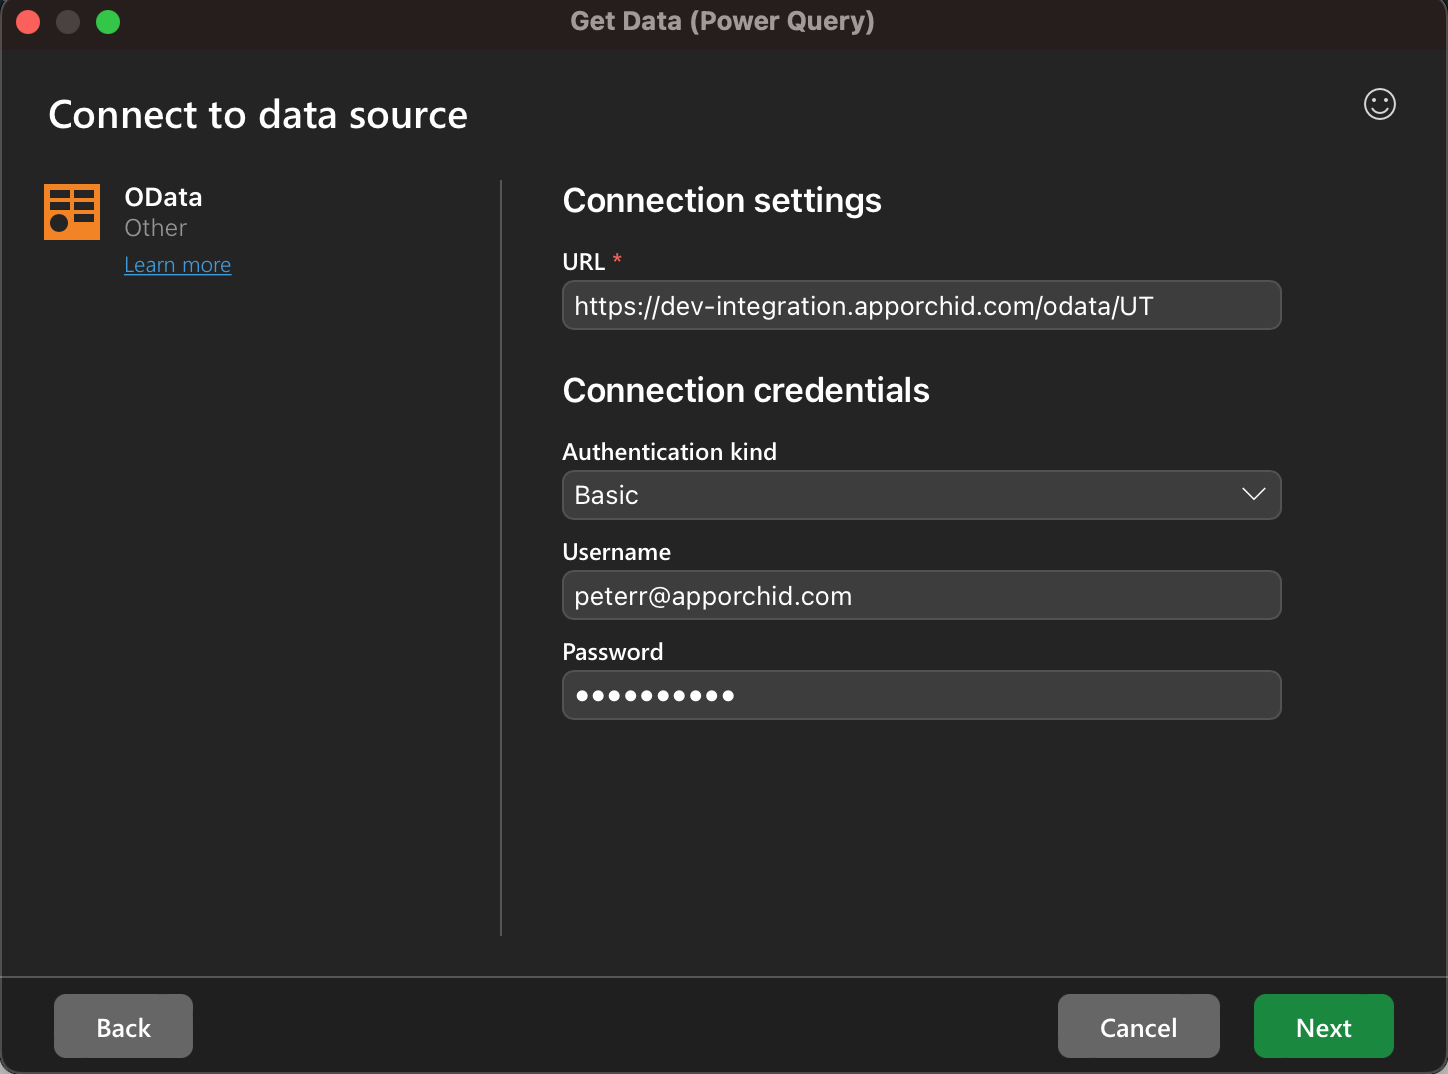
Click OK, and the user will be prompted to sign in with their Username and Password.
|
On Windows |
On MacOS |
|---|---|
|
|
Retrieving Tables from the OData Data Source
-
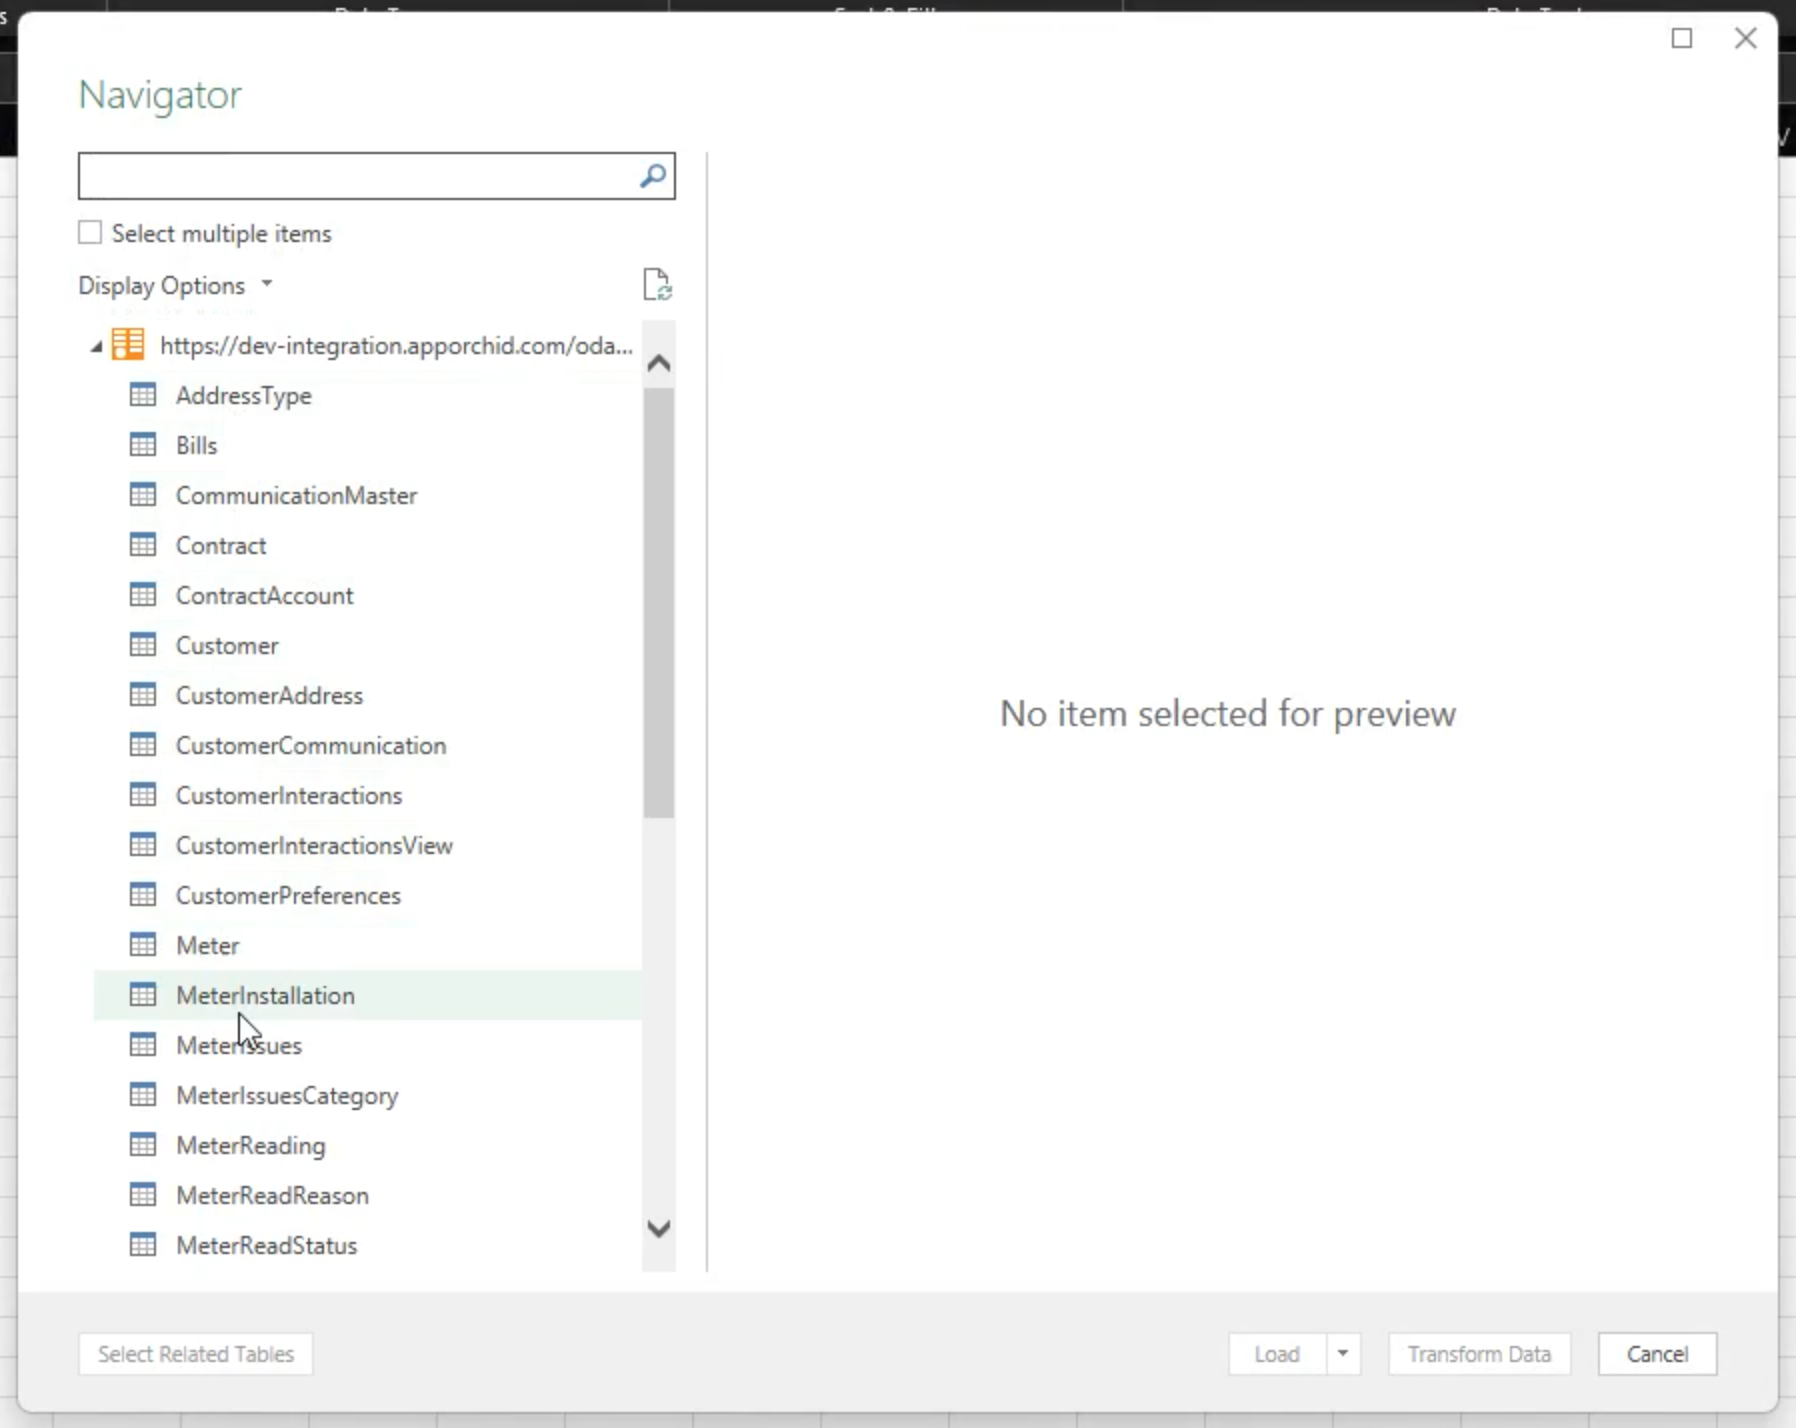
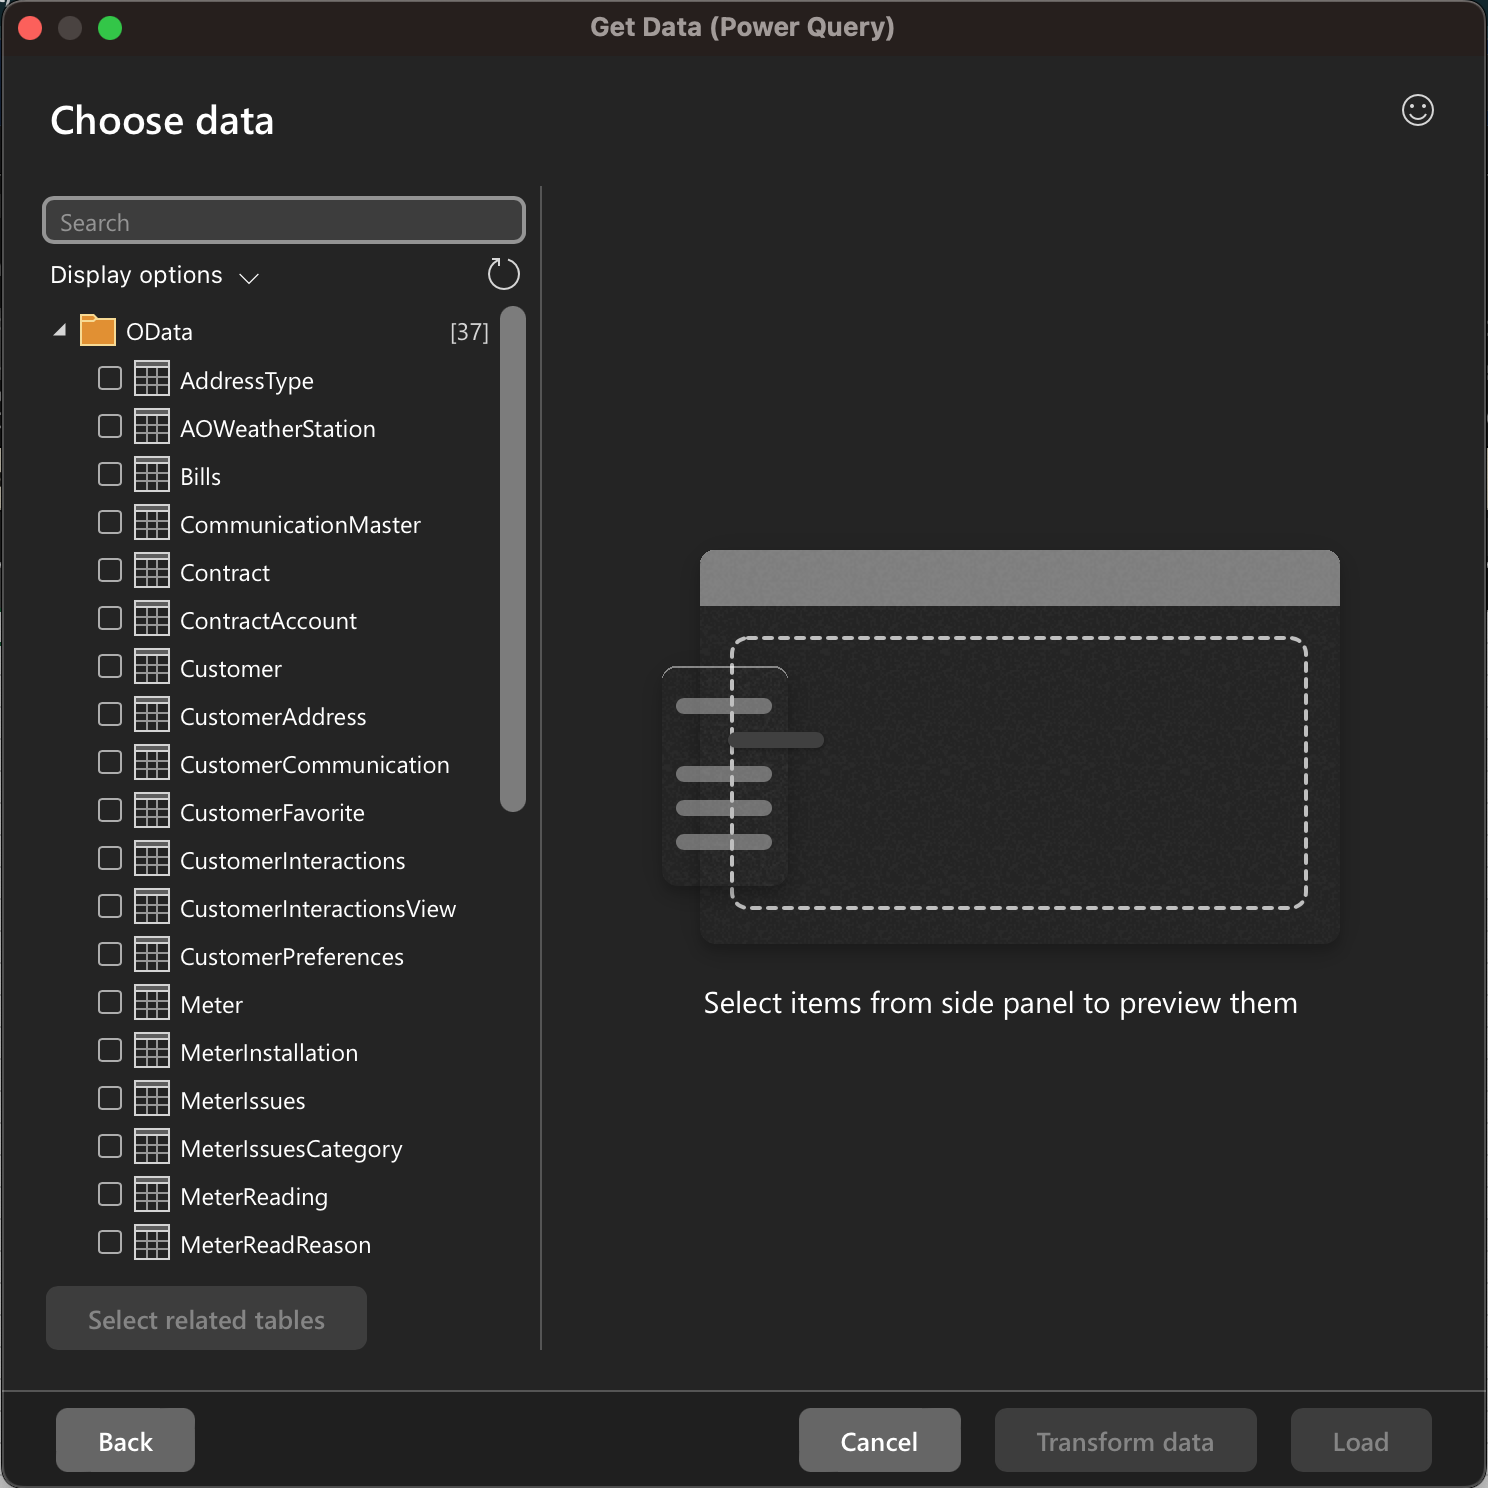
If the AO Platform server is found and authentication is successful, the list of MSO tables will be shown from the Ontology used in the connection string (UT).
-
Select an MSO table from the Navigator. Depending on the volume of the data from the selected MSO table, the preview may take a long time to load.
-
If the full data set is required (all records and all columns), click the Load button to import all data. However, if the data set is very large, it’s better to select the Transform Data button. The Transform Data button opens a dialog from which records can be filtered, and columns can be selected/deselected.
|
On Windows |
On MacOS |
|---|---|
|
|
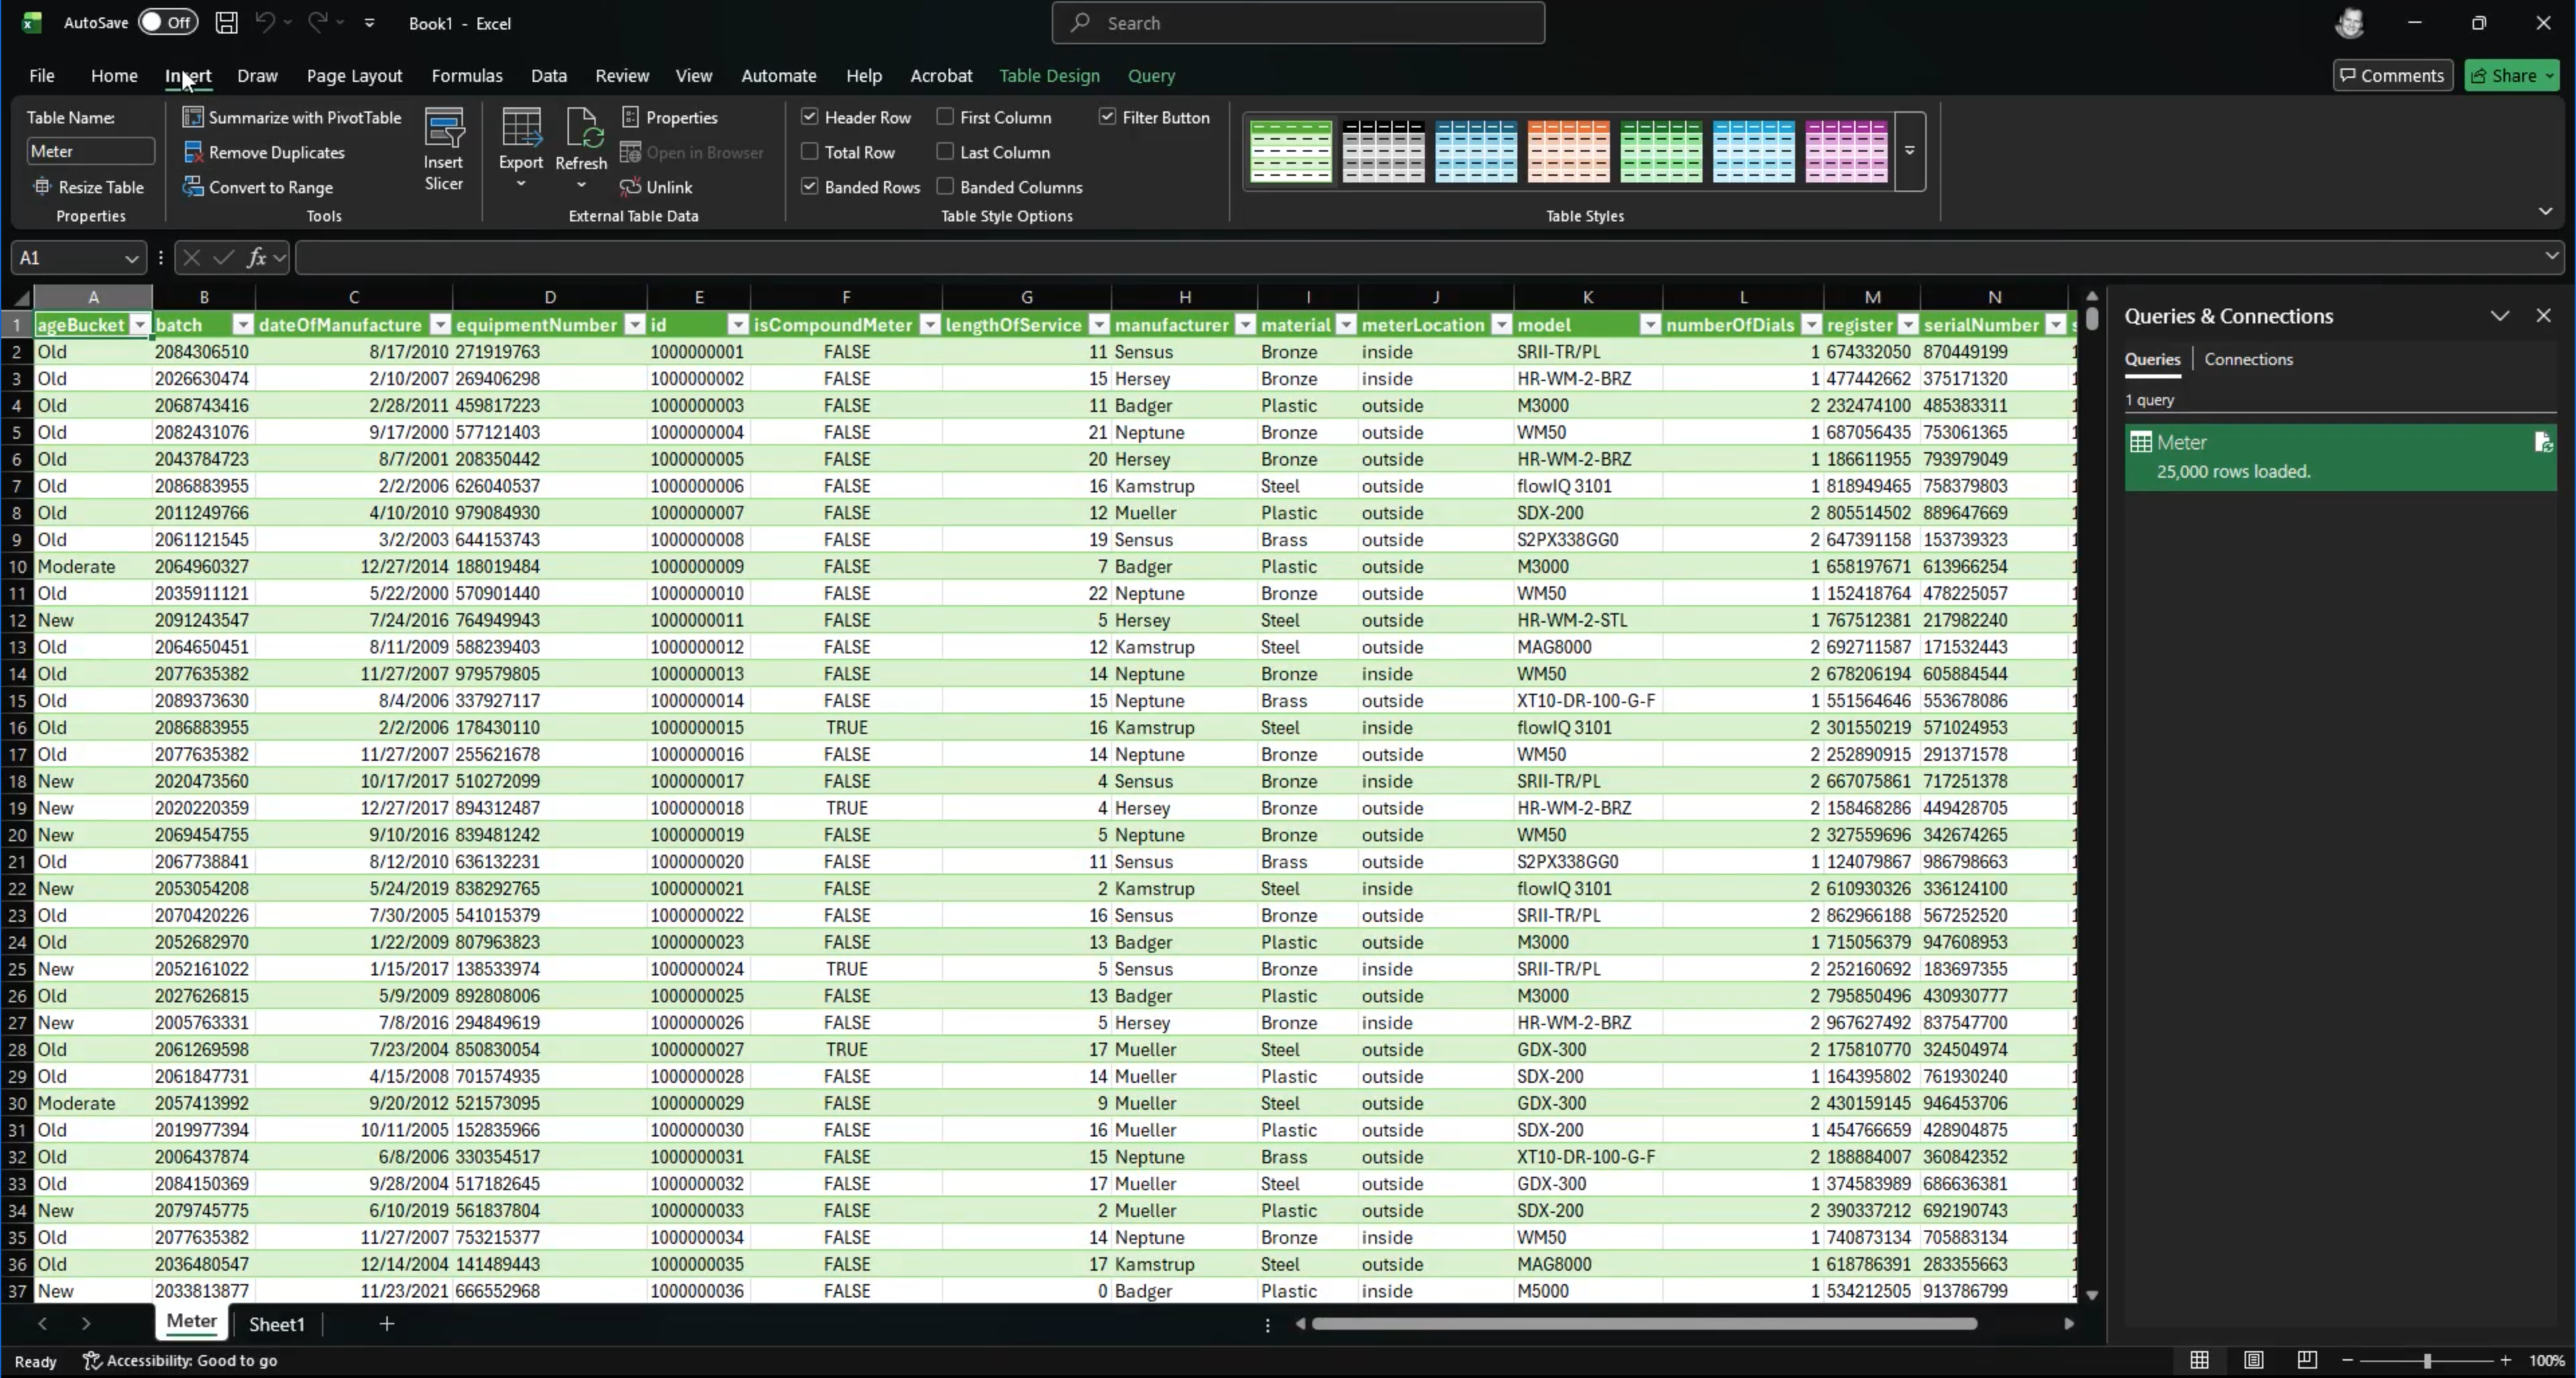
Data Retrieved into the Sheet
-
At this point, regular Excel functionality can be used to slice and dice the table of data.
Creating a Pivot and a Chart
-
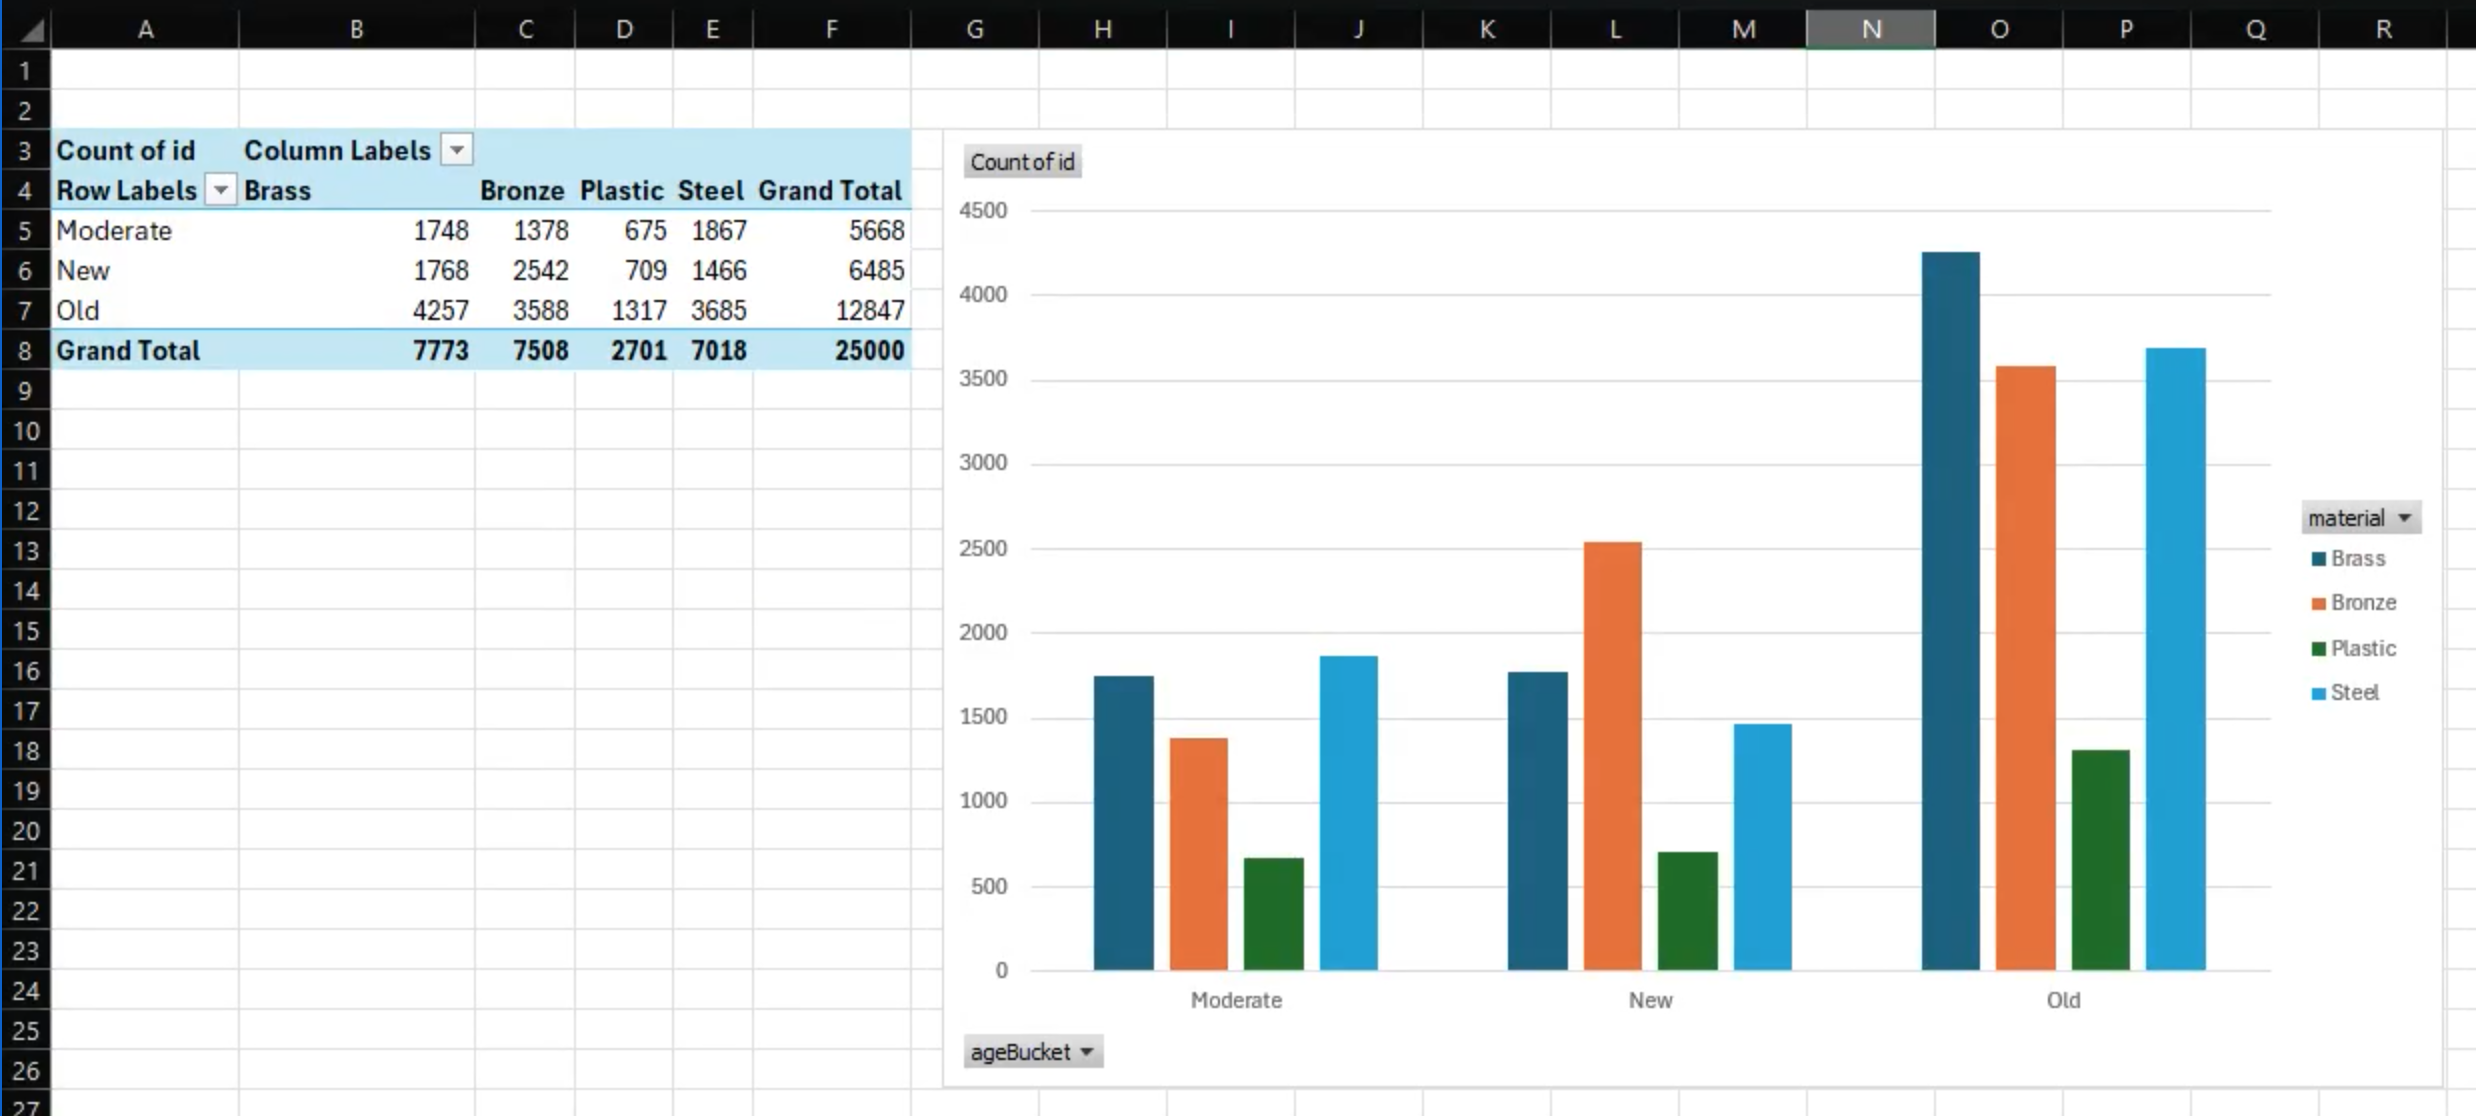
One option is to create a Pivot from the data, and a Chart can be created from the Pivot, as seen in this example.
Contact App Orchid | Disclaimer