Editing a Pipeline
Intended audience: END-USERS ANALYSTS DEVELOPERS ADMINISTRATORS
AO Platform: 4.3
Overview
Using the intuitive design canvas, you can easily create/edit pipelines that read, transform and write data into a format suitable for downstream use in your solutions.
With a pipeline opened in edit mode, the following key areas are available:
Video
Design
The Pipeline Composer has the following user interface for creating, editing, and deploying data pipelines, including: Palette, Canvas, and Properties.
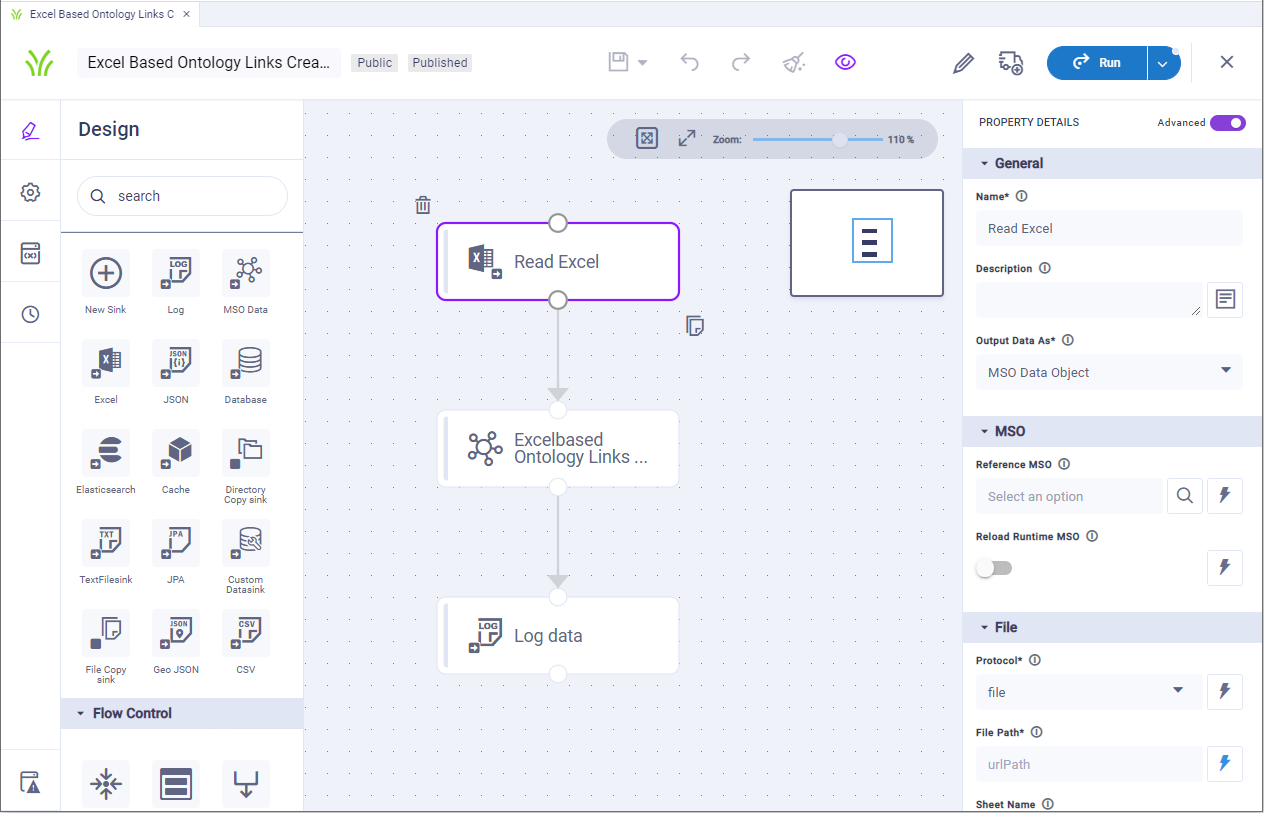
Screenshot: Design screen for the Pipeline Composer containing the data component palette (left panel), the canvas (middle panel), and the properties (right panel) - using a Native Pipeline Runner.
User Actions
Header
Save - various options to Save the Pipeline:
Save - saves the current state of the Pipeline configuration.
Save as - various options to Save the Pipeline as:
Pipeline - select to create a new Pipeline based on the configuration state of the current Pipeline.
Version - select to create a new Version of the configuration state of the current Pipeline. Pipeline Versions can be found under Version History. Also, see Versions and Version History.
Template - select to create a Template from the configuration state of the current Pipeline. Pipeline Templates can be used if multiple Pipelines are to be created based on a specific Template, rather than starting from scratch.
Autosave - toggle allowing for the Pipeline to be automatically saved every 5 minutes.
Undo - click to undo the last action.
Redo - click to redo the last action.
Clear - click to clear all Tasks from the Pipeline Canvas.
View - toggle to enable/disable a thumbnail overview of all Tasks on the Pipeline Canvas.
Delete Draft - deletes the Pipeline. If Pipeline has been Published, both the Draft and Published Pipeline can be deleted after confirmation.
Publish Draft - publishes the Pipeline and updates status from Draft to Published. The pipeline is made read-only.
Edit Pipeline - this option is only available once a Pipeline has been published. If selected, the Pipeline will be opened again allowing the Pipeline to be further configured and, if required, re-published.
Add to Transport - adds the Pipeline to Transport. See Adding a Pipeline to Transport.
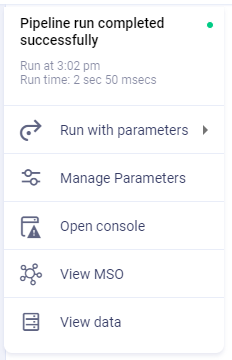
Run - executes the Pipeline. Some additional options are available:
Run with parameters - use this to select from one or more pre-created named parameters, or select Ad-Hoc to add your own parameter values. It’s a prerequisite for the Pipeline configuration to have Variables defined in order to use Run with parameters option - see Variables.
Manage Parameters - opens a dialog that allows the user to create named parameters which can then be selected from Run with parameters menu.
Open Console - opens a Console window showing issues during the Pipeline run.
View MSO - this option is only enabled if the Pipeline uses an MSO-based Sink Task, and after the Pipeline has been run. If enabled, it opens a dialog that shows the user the Fields created for the MSO and also allows the viewing of the MSO Ontology node using the Ontology Viewer.
View data - this option is only enabled when the Pipeline has been run. It opens a dialog showing a table of the resulting data.
Exit - returns to the Pipeline Composer list view.
Palette
Search - allows the user to Search for any Palette Task by name.
Select - use the “+” icon from the respective Palette section to select a Task from the full list of Tasks.
Drag/Drop - can be used with any Task (icon) in the Palette to quickly add a Task to the Canvas.
Canvas
Zoom In/Out - use the slider to Zoom in/out to see more or fewer Tasks on the Canvas.
Delete Task - after selecting a Task on Canvas, click the Delete icon.
Clone Task - after selecting a Task on the Canvas, click Copy icon.
Property Details
Basic / Advanced - toggles between mandatory (Basic) properties and many additional properties (Advanced) for ultimate flexibility.
Palette
When constructing a data pipeline, you’ll generally use one or more of the 4 key Task types inserted onto the Canvas and linked to each other with connector lines:
Each Task type has numerous properties, some mandatory, others optional. You cannot execute (run) a pipeline until all mandatory properties are configured.
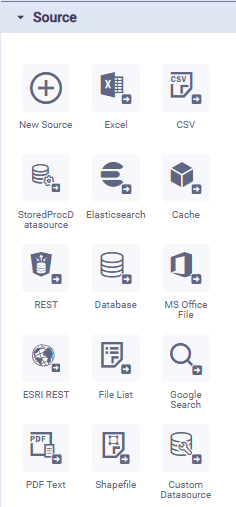
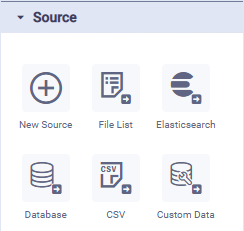
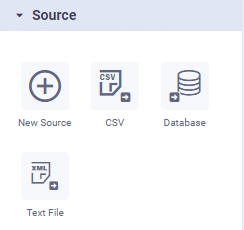
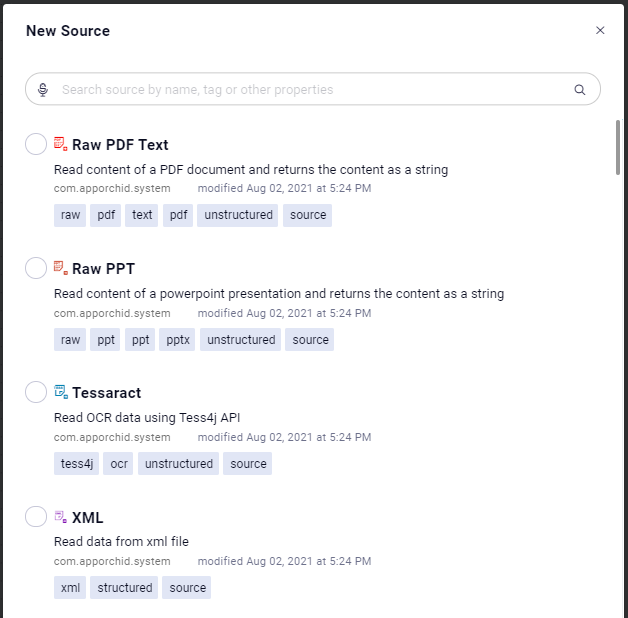
Sources
Data sources in a pipeline allow you to read data from a variety of data files, databases, and web services. In addition to the default/mostly used data sources shown as icons in the palette when using the Pipeline Composer, there are hundreds more data sources to choose from when inserting the New Source onto the pipeline canvas. To use a data source, simply drag and drop the required icon from the Source palette to the canvas (middle section of the screen), then configure the available properties (right-side of screen).
Native Pipeline Runner | Spark Pipeline Runner | Python Pipeline Runner | Additional Sources for Native (short extract) |
|---|---|---|---|
 |  |  |  |
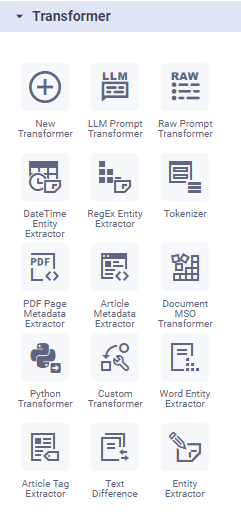
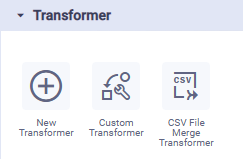
Transforms
Transforms in a pipeline are designed to change the raw data from the data source into something else. This could be simply adding an expression to aggregate data from two columns, or separate content in a single column into multiple separate columns. Multiple Transforms can be added in case it takes multiple operations to get the raw data into a suitable format/configuration. In addition to the default/mostly used transforms shown as icons in the palette when using the Pipeline Composer, there are many more transforms to choose from when inserting the New Transformer onto the pipeline canvas. To use a transformer, simply drag and drop the required icon from the Transformer palette to the canvas (middle section of the screen), connect it to another component on the canvas to define how the data should flow, then configure the available properties (right-side of screen).
Native Pipeline Runner | Spark Pipeline Runner | Python Pipeline Runner | Additional Transforms for Native (short extract) |
|---|---|---|---|
 |  | 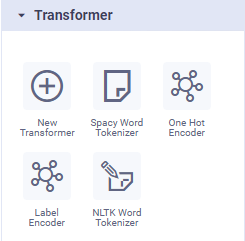 | 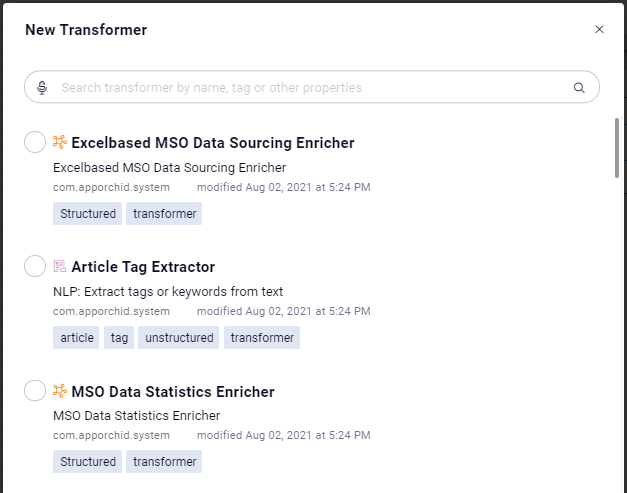 |
Sinks
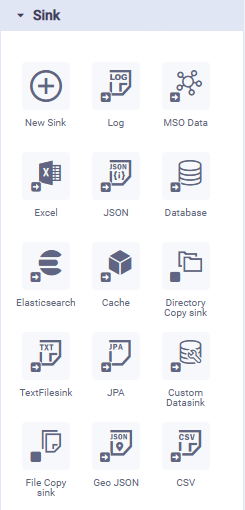
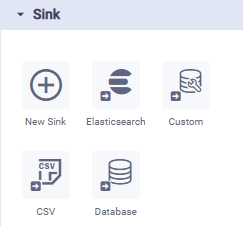
Data sinks in a pipeline allow you to write data to a variety of data files, databases, and web services. In addition to the default/mostly used data sinks shown as icons in the palette when using the Pipeline Composer, there are many more data sinks to choose from when inserting the New Sink onto the pipeline canvas. To use a data sink, simply drag and drop the required icon from the Sink palette to the canvas (middle section of the screen), connect it to another component on the canvas to define how the data should flow, then configure the available properties (right-side of screen).
Native Pipeline Runner | Spark Pipeline Runner | Python Pipeline Runner | Additional Sinks for Native (short extract) |
|---|---|---|---|
 |  |  | 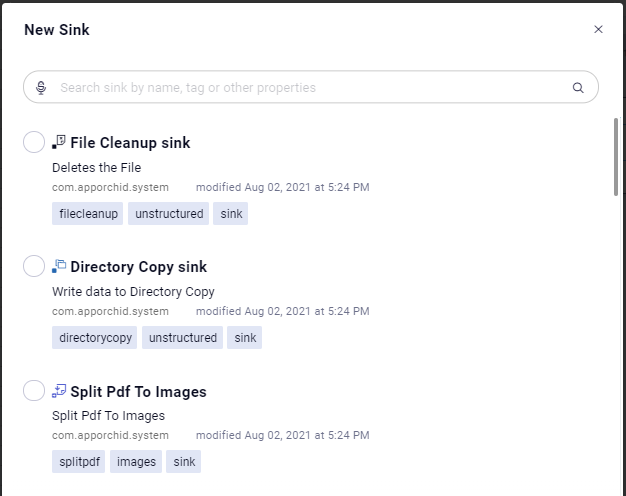 |
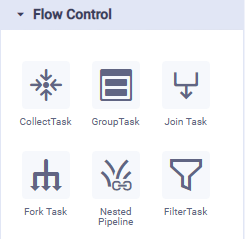
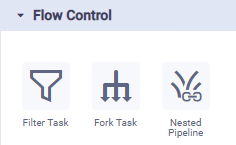
Flow Controls
Flow Controls in a pipeline are designed to control the flow of the data. Some common flows are joining two data sources, or splitting a data source into two separate data sinks, maybe based on a filter. Multiple Flow Controls can be added in case it takes multiple operations to get the raw data into a suitable format/configuration. To use flow control, simply drag and drop the required icon from the Flow Control palette to the canvas (middle section of the screen), connect it to other components on the canvas to define how the data should flow, then configure the available properties (right-side of screen).
Native Pipeline Runner | Spark Pipeline Runner | Python Pipeline Runner | Descriptions |
|---|---|---|---|
 |  | N/A |
|
Canvas
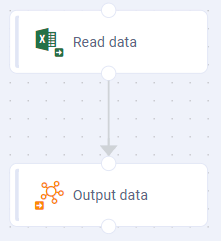
Pipelines can be extremely simple or they can be rather advanced/complex in nature - all depending on how the raw data from the data source need to be “prepared” for downstream use. The Canvas allows users to connect all the different Tasks from the Palette into a Pipeline of varying degrees of complexity. A few examples are shown below:
Pipeline example 1 | Pipeline example 2 | Pipeline example 3 |
|---|---|---|
Reading data from an Excel spreadsheet with output to an MSO (Managed Semantic Object) | Reading data from any structured data source, doing some data transformation, then writing data to an MSO | Reading from a CSV file, Computing a Risk Score (using a Lambda function), then writing to an MSO |
 | 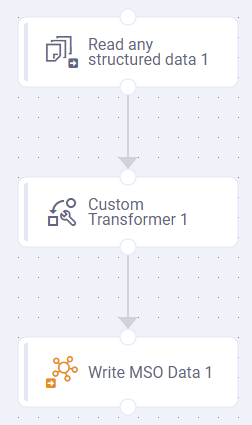 | 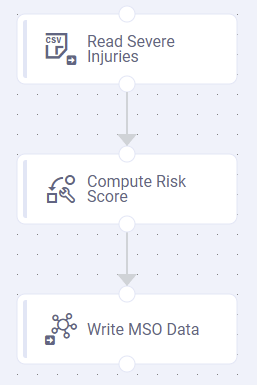 |
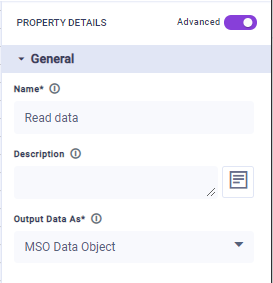
Properties
Each Task added to the Canvas will have Properties, some mandatory (identified by an * after the Property label), others optional. Use the Property Panel to configure a minimum the mandatory Properties. There are two general groups of Properties; Basic and Advanced. See Configuring Properties.
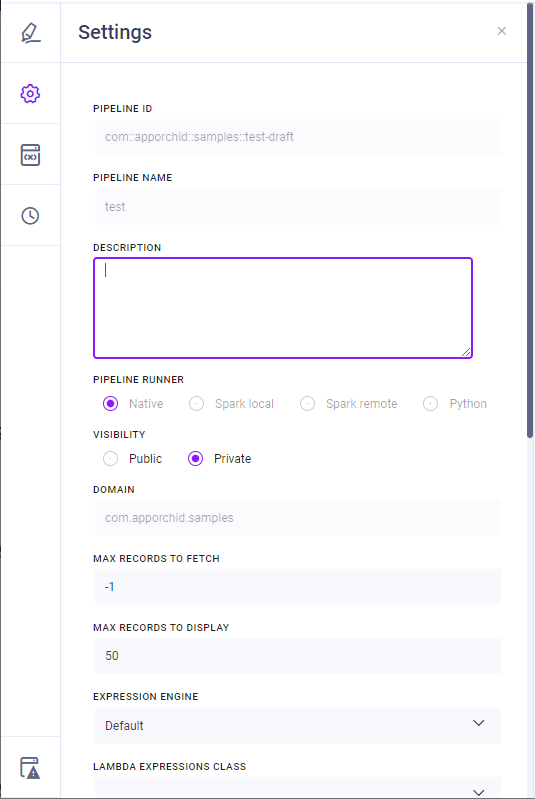
Settings
The Settings slide-out panel allows the user to view and configure some common properties for the Pipeline.
Properties
Label | Description |
|---|---|
Pipeline ID | Displays the ID of the Pipeline created. Auto-created as a combination of the Domain and the Pipeline Name provided in the format: com::apporchid::samples::pipeline_name. Read-only. |
Pipeline Name | Displays Name of the Pipeline created. Read-only. |
Description | Short paragraph describing the purpose of the Pipeline. |
Pipeline Runner | Displays the “platform” where the Pipeline will be executed. Read-only. Options are:
|
Spark Provider | This option is only available/visible if Spark remote option is selected for Pipeline Runner. It determines where the Spark remote execution takes place. Allows user to select between:
|
Cluster Config | This option is only available/visible if Spark remote option is selected for Pipeline Runner, and if EMR is selected for Spark Provider. Select from dropdown which Cluster configuration to use in the EMR platform. |
Spark Config Properties | Configure additional Spark Configuration properties as Key/Value pairs. |
Visibility | Select between Public or Private. A Private Pipeline cannot be seen or accessed by other users. |
Domain | Displays the Domain for the new Pipeline. As this is the name of the package for the Domain, it’s typically expressed in the reverse Domain name format: com.apporchid.samples. Read-only. |
Max Records to Fetch | Default: -1 |
Max Records to Display | Default: 50 |
Expression Engine | Select from available Expression Engines. Default is: Default. |
Lambda Expression Class | Select from available FunctionHelper classes. |
Property Value Function Class | Select from available FunctionHelper classes. |
Pipeline Event Listener Class | Select from available EventListener classes. |
Cache Type | Select between either User Session or Global Cache. |
Report Errors As | Search dialog that allows user to determine how errors are reported. |
Error Scope | Select the scope of errors reported: All or Uncaught. |
Categories | Select one or more checkboxes for the relevant Categories for the Pipeline. |
Tags | Add list of Tags. |
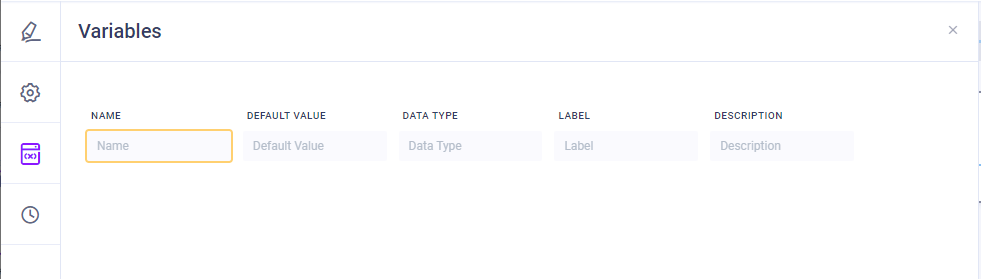
Variables
The Variables slide-out panel allows the user to configure any number of input variables for the Pipeline, including name, default value, data type, label, and description.
Version History
See Versions and Version History.
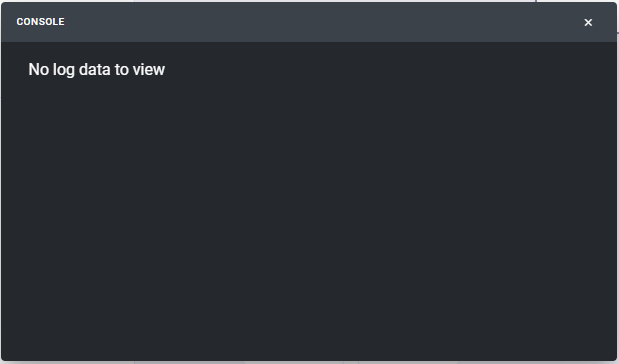
Console
The Console window will show the log output when a Pipeline is Run to help troubleshoot complex Pipelines.
Finalizing editing a Pipeline
The following Pipeline actions can be taken during the editing of the Pipeline:
Save - allows the user to save the Pipeline (Save, Save as Pipeline/Version/Template).
Publish draft - allows the user to publish the Pipeline to the server. The Pipeline status will now be Published. Any draft nested Pipelines in the Pipeline being published will also be published.
Run - allows the user to execute the data Pipeline to show the output of the data for validation.
Delete draft - allows the user to delete the Pipeline.
Transport - allows the user to enable the Pipeline for export via Transport Tool.