
Intended audience: Developers Administrators
AO Platform: 5.0
Overview
This option allows the user to open dialogs to view performance and statistical insights from asking questions in Easy Answers solutions using the selected Ontology. There are two separate submenus:
-
Easy Answers - provides stats relative to individual questions from different sources.
-
Agent - provides stats relative to questions in the conversations done in the Easy Answers Agent.
Easy Answers
This option displays performance and statistics for Easy Answers questions, including Recent Questions and Slowest Questions, across various question sources (Easy Answers, Agent, and API).
Overview tab
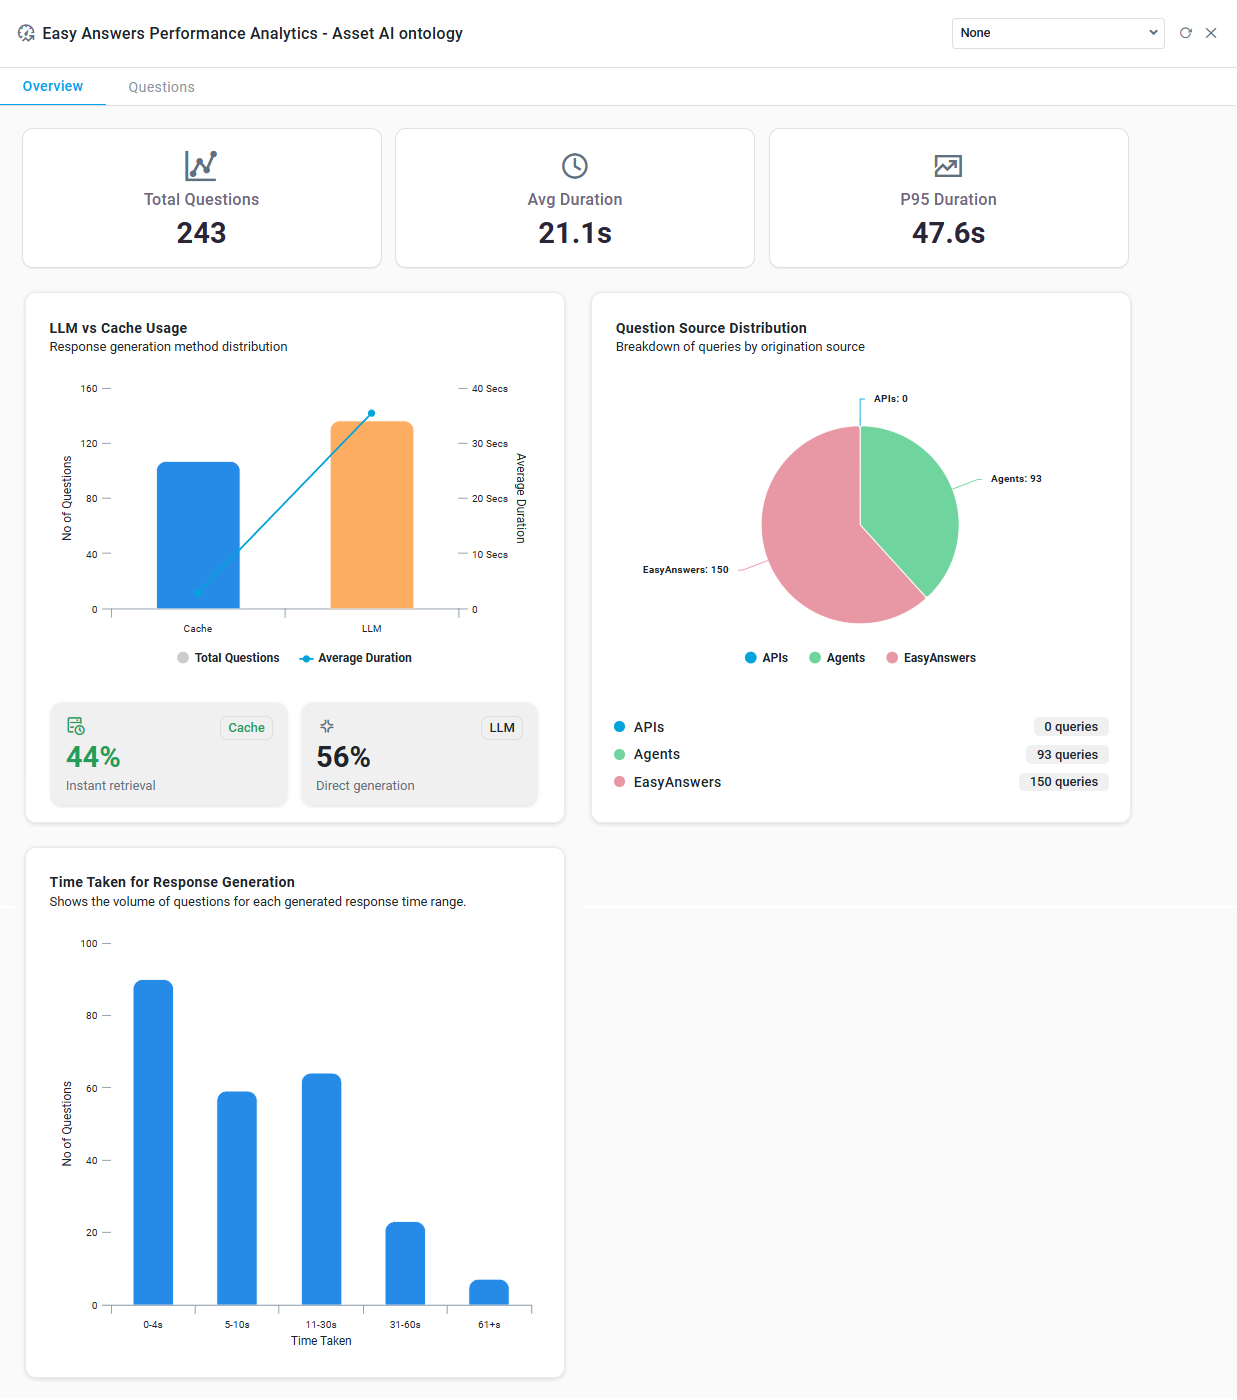
This tab provides statistical information, including Total Questions, Avg Duration (execution time), and P95 Duration (95% probability for execution time). Additionally, the following charts are shown:
-
LLM vs Cache Usage - Bar/Line Chart - showing the source of the response: Cache or LLM, and the average duration to generate responses.
-
Question Source Distribution - Pie Chart - showing a breakdown of questions from each of the three sources: Easy Answers, Agents, and APIs.
-
Time Taken for Response Generation - Bar Chart - showing the volume of questions for each generated response time range.
Actions - in Header
-
Time Range - filter - select a time period from the dropdown to filter the data in the Apps displayed in the Performance Analytics dialog.
-
Refresh - click to refresh the Performance Analytics dialog.
-
Close - X icon.
Questions tab
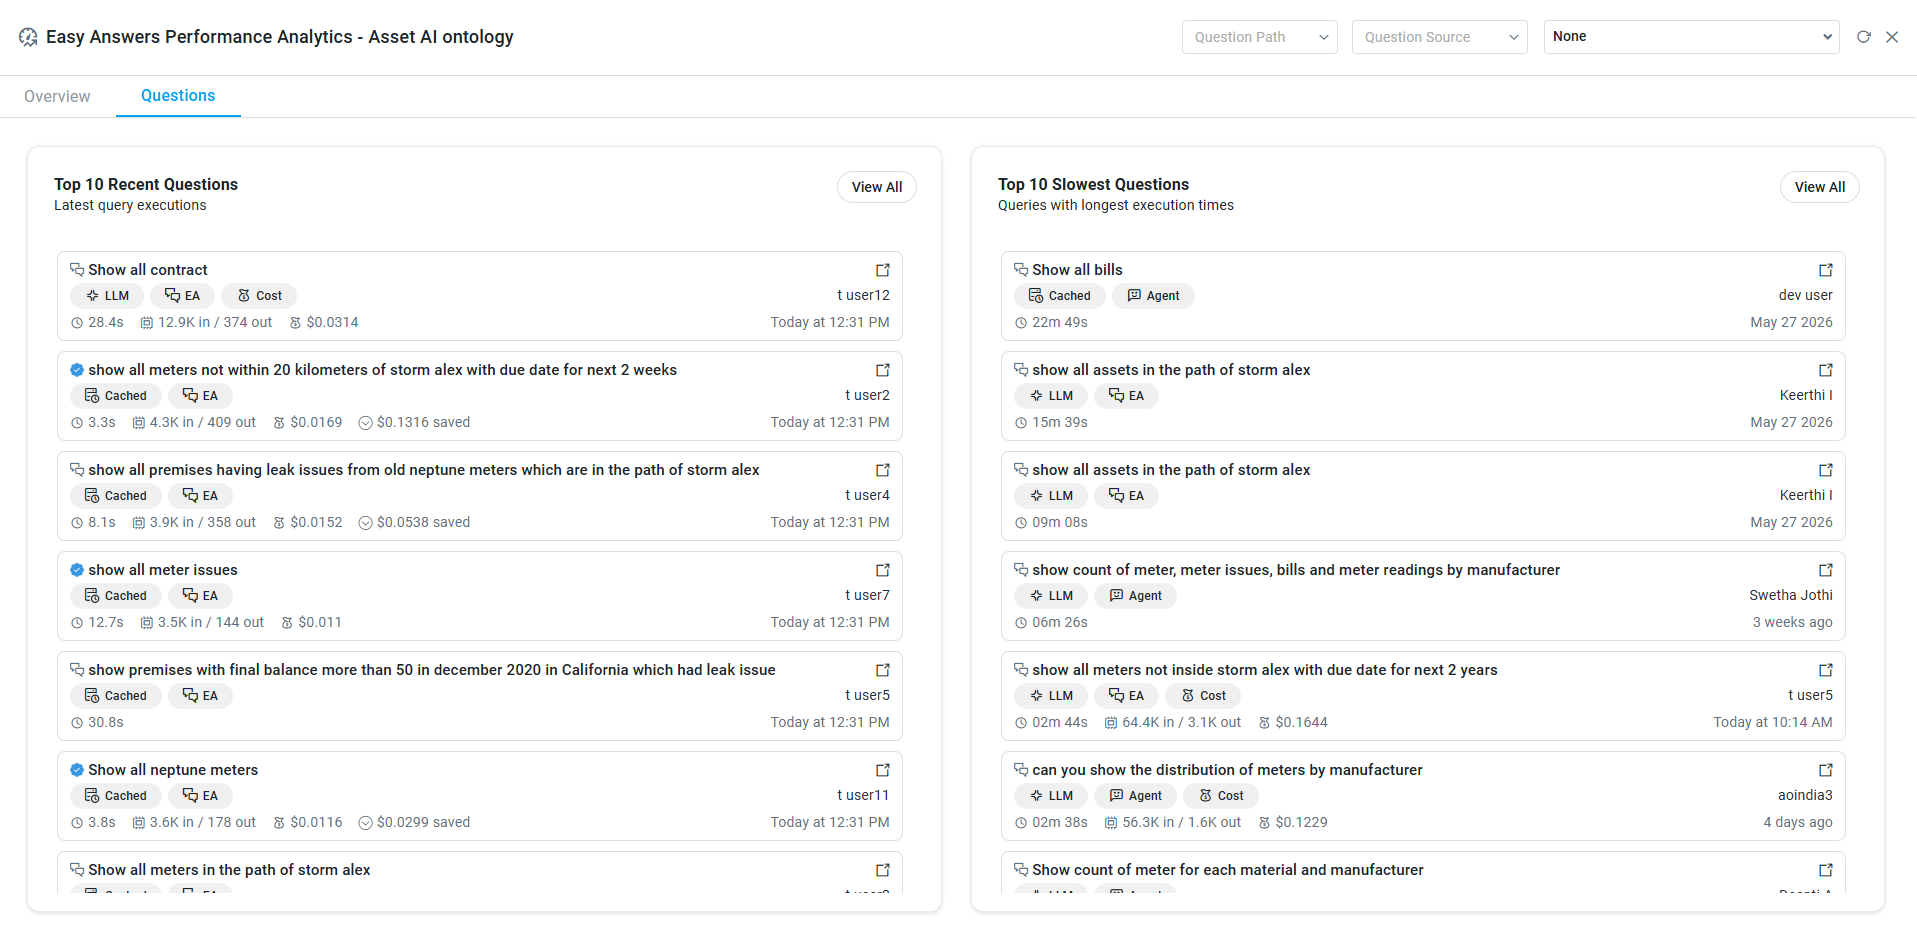
This tab provides insight into the Top 10 Recent and Slowest Questions, as well as identifying where questions are executed from (LLM/Template/Cache) and the source of the questions (Easy Answers/Agent/API). For each question, the following content is available:
-
Icon - indicates whether or not the question has been verified. A “blue badge” indicates the verified status.
-
Question - shows the full question that was asked.
-
Interpreted by Tag - shows how the question was interpreted (LLM, Template, or Cache).
-
Question Source Tag - the source system in which the question was asked (EA, Agent, or API).
-
Cost Tag - shows if an LLM transaction cost was incurred during processing.
-
Username - the name of the user associated with the question.
-
Execution Time - the time it took to process the question.
-
Tokens In/Out - values for how many tokens were sent to the LLM and how many were received.
-
Approximate Cost - value indicating the approximate cost of the LLM interaction during question processing.
-
Approximate Saving - value indicating the approximate saved cost due to the question being executed from cache and therefore has minimum LLM interaction.
-
Timestamp - the time of the question execution.
Actions - in Header
-
Question Path - filter - select a question path, including Cached or LLM - only available when on the Questions tab.
-
Question Source - filter - select a Question Source, including Easy Answers, Agents, or APIs - only available when on the Questions tab.
-
Time Range - filter - select a time period from the dropdown to filter the data in the Apps displayed in the Performance Analytics dialog.
-
Refresh - click to refresh the Performance Analytics dialog.
-
Close - X icon.
Actions - on the Questions tab
-
View All - click on the View All button to open a dialog showing all Questions (Recent or Slowest Questions).
-
This subdialog lets you filter by Interpreted by Tag and User, as well as use the general Search option.
-
-
Execute Question in Easy Answers - click on the

Agent
-
This option shows performance and statistics for Agent Tools, ie, which Tools were used by the Agent to interpret and answer questions.
Overview tab
This tab provides statistical information, including Total Questions, Avg Duration (execution time), and P95 Duration (95% probability for execution time).
Actions - in Header
-
Time Range - filter - select a time period from the dropdown to filter the data in the Apps displayed in the Performance Analytics dialog.
-
Refresh - click to refresh the Performance Analytics dialog.
-
Close - X icon.

Questions tab
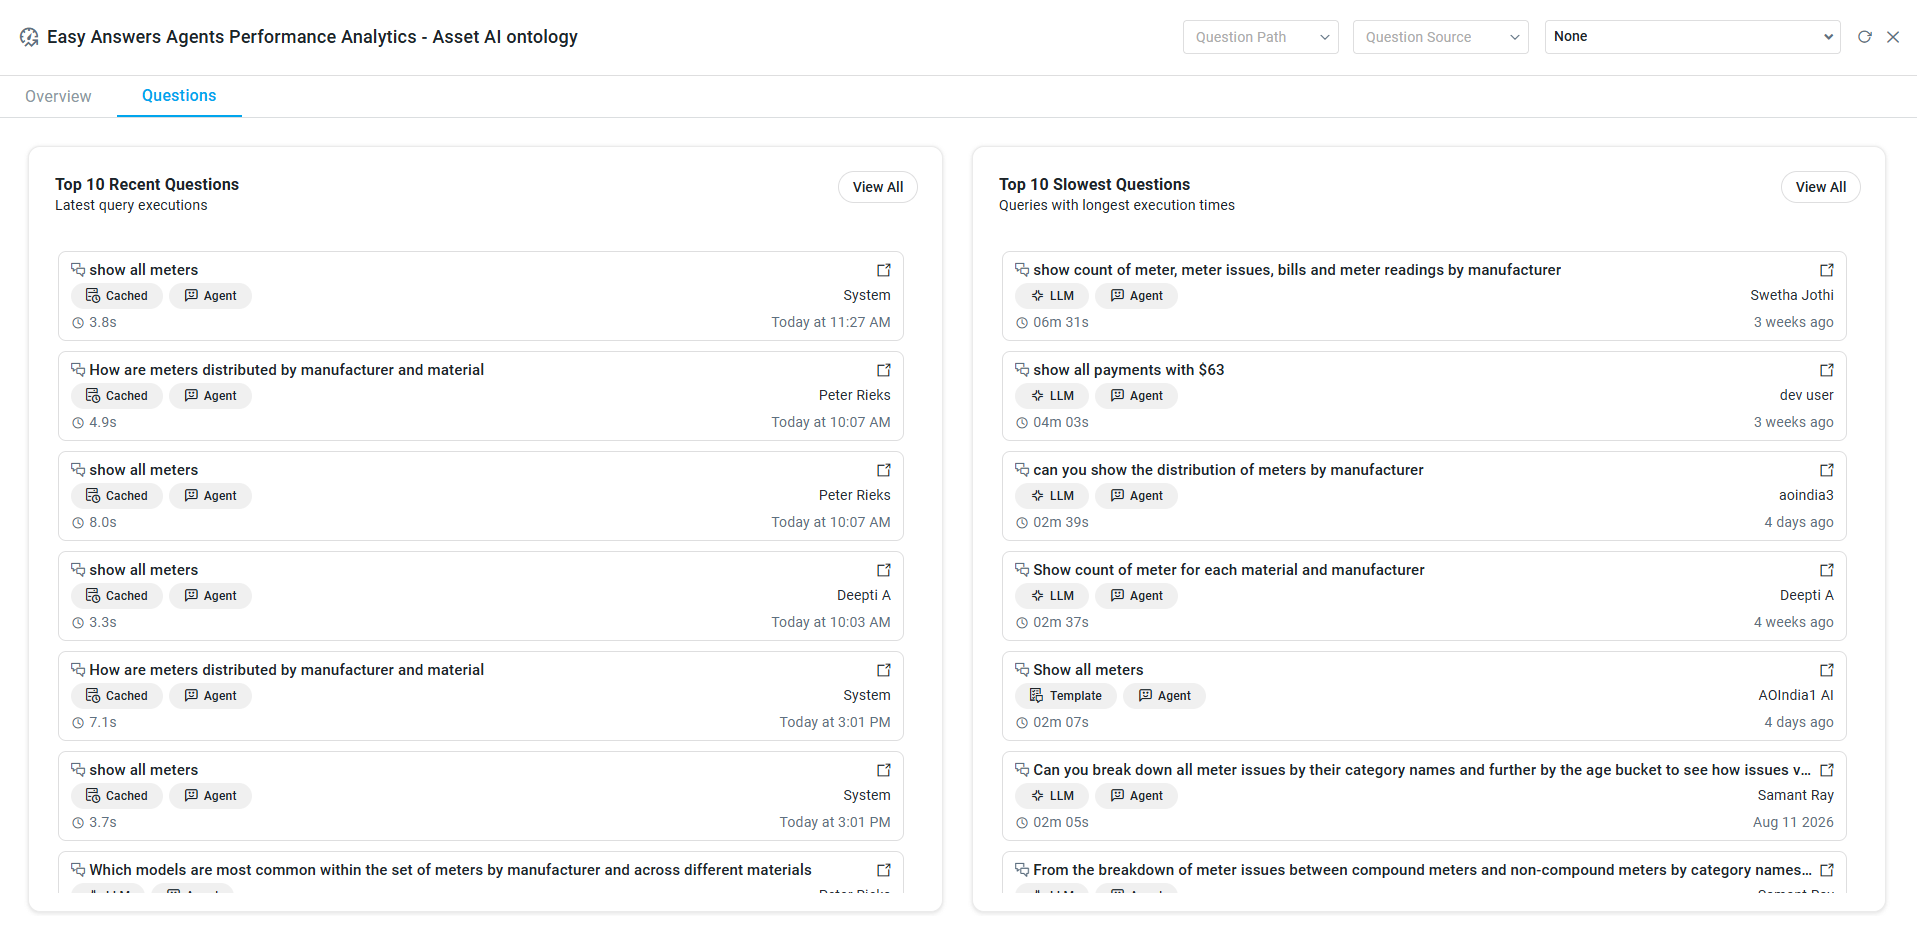
This tab provides insight into the Top 10 Recent and Slowest Questions, as well as identifying where questions are executed from (LLM/Template/Cache) and the source of the questions (Easy Answers/Agent/API). For each question, the following content is available:
-
Icon - indicates whether or not the question has been verified. A “blue badge” indicates the verified status.
-
Question - shows the full question that was asked.
-
Interpreted by Tag - shows how the question was interpreted (LLM, Template, or Cache).
-
Question Source Tag - the source system in which the question was asked (EA, Agent, or API).
-
Username - the name of the user associated with the question.
-
Execution Time - the time it took to process the question.
-
Timestamp - the time of the question execution.
Actions - in Header
-
Question Path - filter - select a question path, including Cached or LLM - only available when on the Questions tab.
-
Question Source - filter - select a Question Source, including Easy Answers, Agents, or APIs - only available when on the Questions tab.
-
Time Range - filter - select a time period from the dropdown to filter the data in the Apps displayed in the Performance Analytics dialog.
-
Refresh - click to refresh the Performance Analytics dialog.
-
Close - X icon.
Actions - on the Questions tab
-
View All - click on the View All button to open a dialog showing all Questions (Recent or Slowest Questions).
-
This subdialog lets you filter by Interpreted by Tag and User, as well as use the general Search option.
-
-
Execute Question in Easy Answers - click on the
Contact App Orchid | Disclaimer