Intended audience: end-users developers
AO Platform: 4.5
Test for Proportions
The Model tab generally includes one or more of the following sections:
-
Data Fields - these are the data field configuration properties mandatory for the model to execute.
-
Model Specific Configurations - configuration properties in this section will vary depending on the selected model. If the model does not require additional configuration, the section(s) will not be shown.
Background
What?
-
A statistical method to analyze CATEGORICAL COUNT DATA and compare PROPORTIONS across multiple categories usingBayesian inference.
-
DATA TYPE: CATEGORY COUNTS
-
Multiple categories (3 or more typically).
-
Counts in each category (non-negative integers).
-
Result: Proportions that SUM TO 1.
-
-
KEY OUTPUT
-
Posterior distribution of each category's proportion (theta).
-
Proportions ALWAYS sum to 1 (Dirichlet distribution).
-
Why?
-
INTUITIVE RESULTS ("Mobile traffic is 55% with 95% CI [53%, 57%]" )
-
UNCERTAINTY QUANTIFICATION (Get full distribution for each category proportion)
-
WORKS WITH SMALL SAMPLES (Bayesian inference handles small counts gracefully)
-
HIERARCHICAL MODELING
-
Compare related groups (partial pooling)
-
Compare independent groups (no pooling)
-
Single global estimate (complete pooling)
-
-
MULTIPLE COMPARISON TYPES
-
ONE-SAMPLE: Test if distribution matches expected
-
HOMOGENEITY: Test if groups have same proportions
-
INDEPENDENCE: Test if groups have different proportions
-
How?
-
STEP 1: Verify your data format
-
Each COLUMN = one category.
-
Each ROW = one sample (group).
-
Values = counts (non-negative integers).
-
-
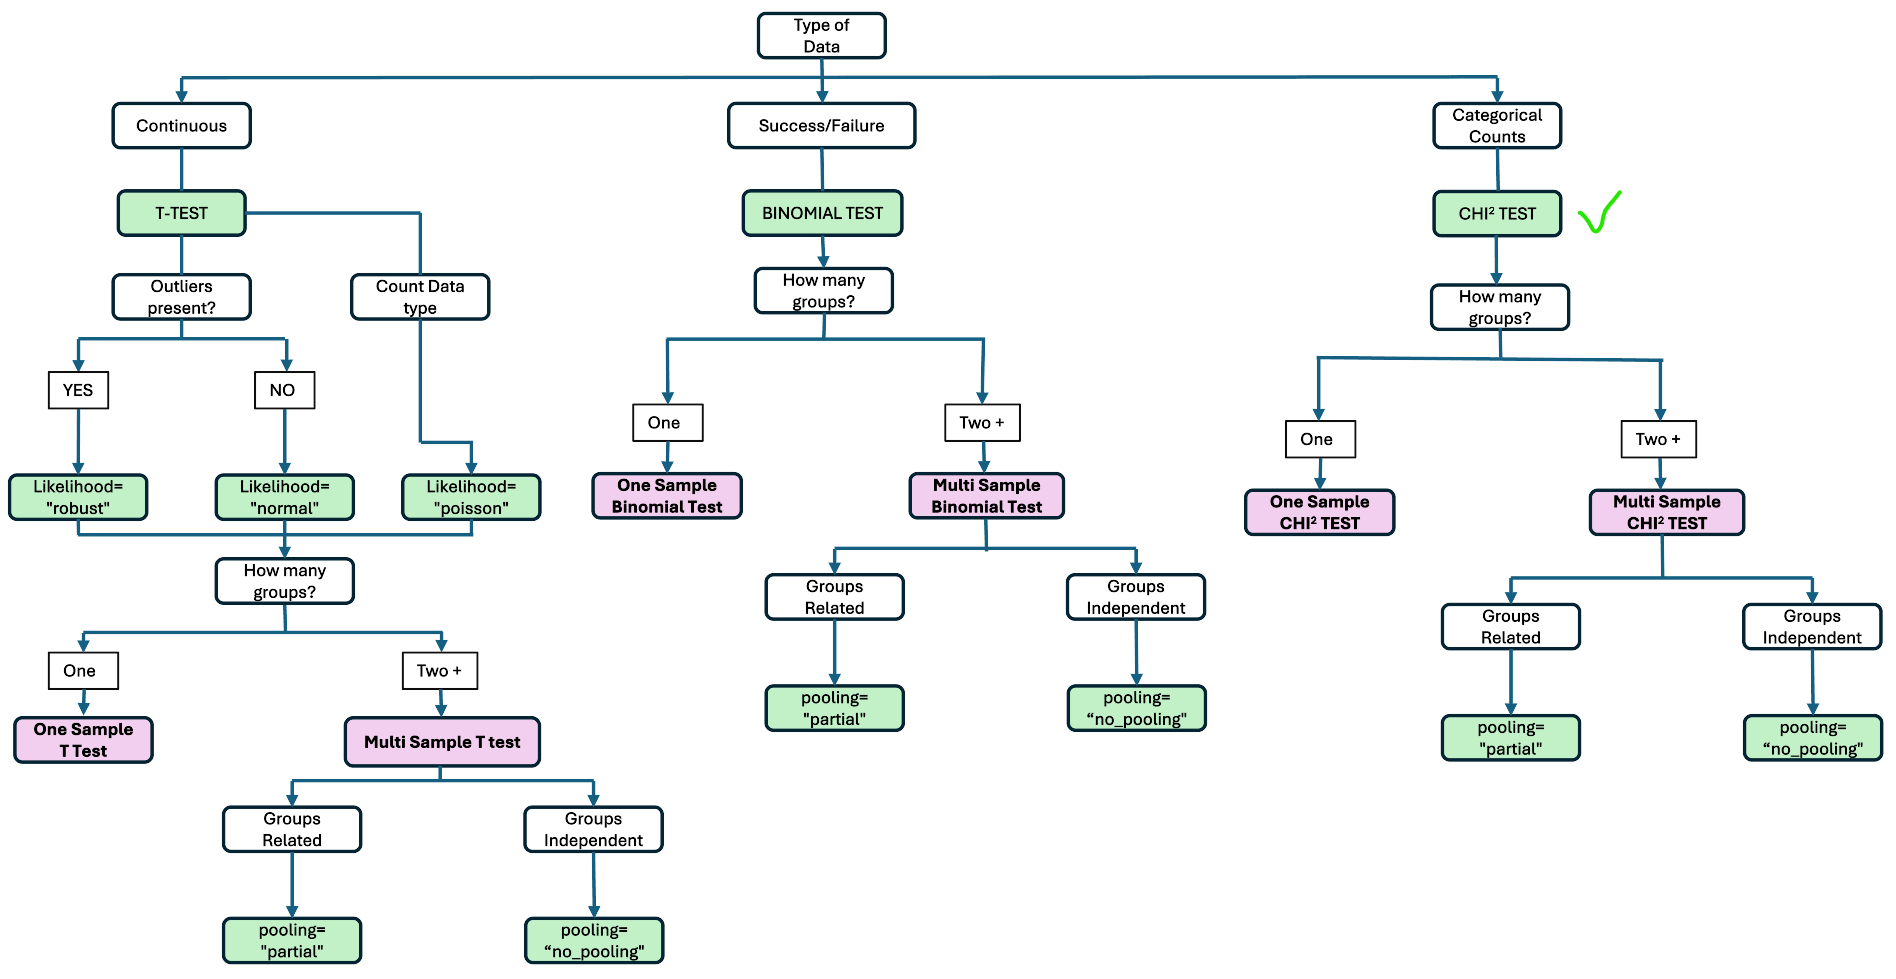
STEP 2: How many samples (rows)?
-
ONE sample (1 row) --> One Sample Chi2 test
-
MULTIPLE samples --> Choose based on relationship
-
For multiple samples - are they related?
|
Scenario |
Samples are... |
Use Pooling |
|---|---|---|
|
|
|
|
|
|
|
|
|
Configuration Flow
Chi-Squared Test (Goodness of Fit)
Properties
|
Label |
UI |
Default |
Description |
|---|---|---|---|
|
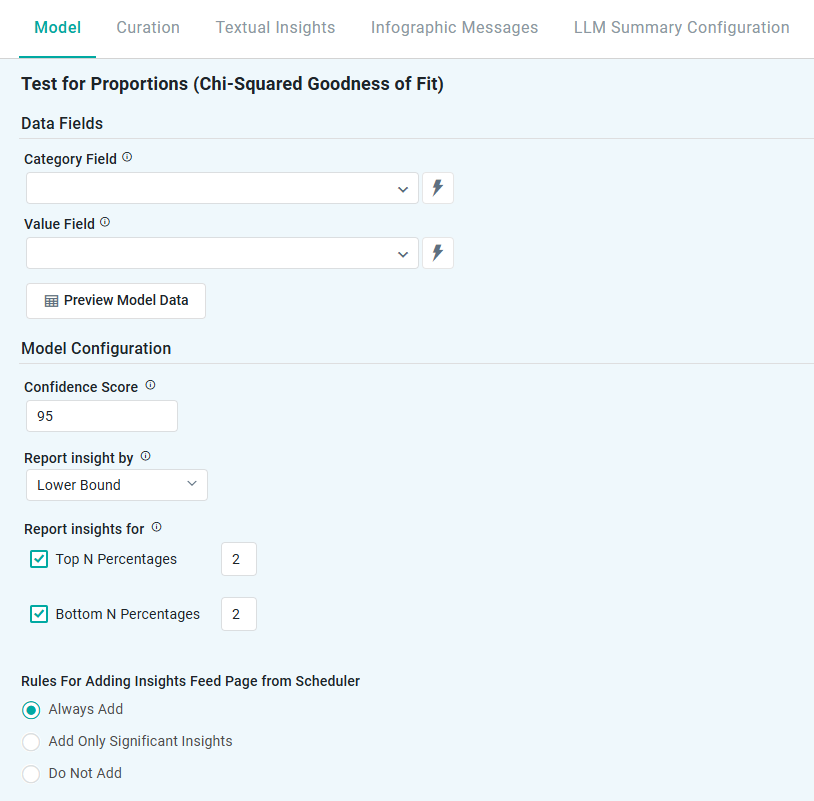
Data Fields |
|
|
|
|
Dropdown w/Expression |
|
Represents non-numeric groupings (eg, product type, customer segment) used to compare differences across multiple samples. |
|
Dropdown w/Expression |
|
The numerical data being analyzed (eg, sales, conversion rate) to test whether differences between groups are statistically significant. |
|
Button |
|
Opens a dialog to view the data that will be used by the model. See Model > Model tab | Preview Model Data Dialog. |
|
Model Configuration |
|
|
|
|
Number field |
95 |
Represents the range in which the true prediction is expected to fall, based on a chosen confidence level. For example, a 95% confidence level means there’s a 95% chance the actual value lies within that range. Users can adjust the confidence level (eg, 90 to 99), with higher levels widening the interval to reflect greater certainty. |
|
Dropdown |
Lower Bound |
Defines how insights are generated based on key statistical measures:
|
|
Checkboxes |
2 |
This setting allows users to focus on the Top N or Bottom N categories based on their proportions. Top N - highlights the categories with the highest proportions (eg, top-performing products or highest conversion rates). Bottom N - identifies the categories with the lowest proportions (eg, underperforming regions or lowest customer engagement). |
|
Rules for Adding to Insights Feed Page from Scheduler |
Radio-buttons |
|
This section allows the user to select if the Quick Insight will be added to the Insights Feed page when generated from a Scheduled Task. See Model > Model tab | Rules for Adding Insights Feed Page from Scheduler. |
Contact App Orchid | Disclaimer