Intended audience: end-users developers
AO Platform: 4.5
Test for Rates
The Model tab generally includes one or more of the following sections:
-
Data Fields - these are the data field configuration properties mandatory for the model to execute.
-
Model Specific Configurations - configuration properties in this section will vary depending on the selected model. If the model does not require additional configuration, the section(s) will not be shown.
Background
What?
-
A statistical method to analyze SUCCESS/FAILURE data and compare rates using Bayesian inference.
-
DATA TYPE: COUNT DATA
-
Successes: How many converted, passed, clicked, responded?
-
Total Trials: How many visitors, units, emails, patients?
-
Result: Success RATE (probability between 0 and 1)
-
-
KEY OUTPUT
-
Posterior distribution of each group's success rate (theta).
-
Credible intervals (like confidence intervals, but interpretable!).
-
Direct probability statements: P(Treatment > Control) = 94%.
-
Why?
-
INTUITIVE RESULTS ("There's a 94% probability that the new landing page beats the old one“)
-
UNCERTAINTY QUANTIFICATION (Get full distribution of possible success rates)
-
WORKS WITH SMALL SAMPLES (Partial pooling borrows strength across groups)
-
FLEXIBLE POOLING STRATEGIES
-
Complete: Single rate (benchmark testing)
-
Partial: Related groups (categories, regions)
-
No Pooling: Independent groups (drugs, treatments)
-
How?
-
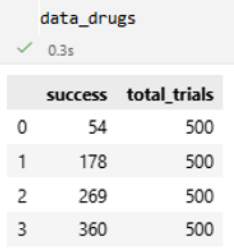
STEP 1: Verify your data is SUCCESS/FAILURE counts
-
Each row = one group.
-
Column 1: Number of successes (conversions, passes, clicks).
-
Column 2: Total number of trials (visitors, units, emails).
-
-
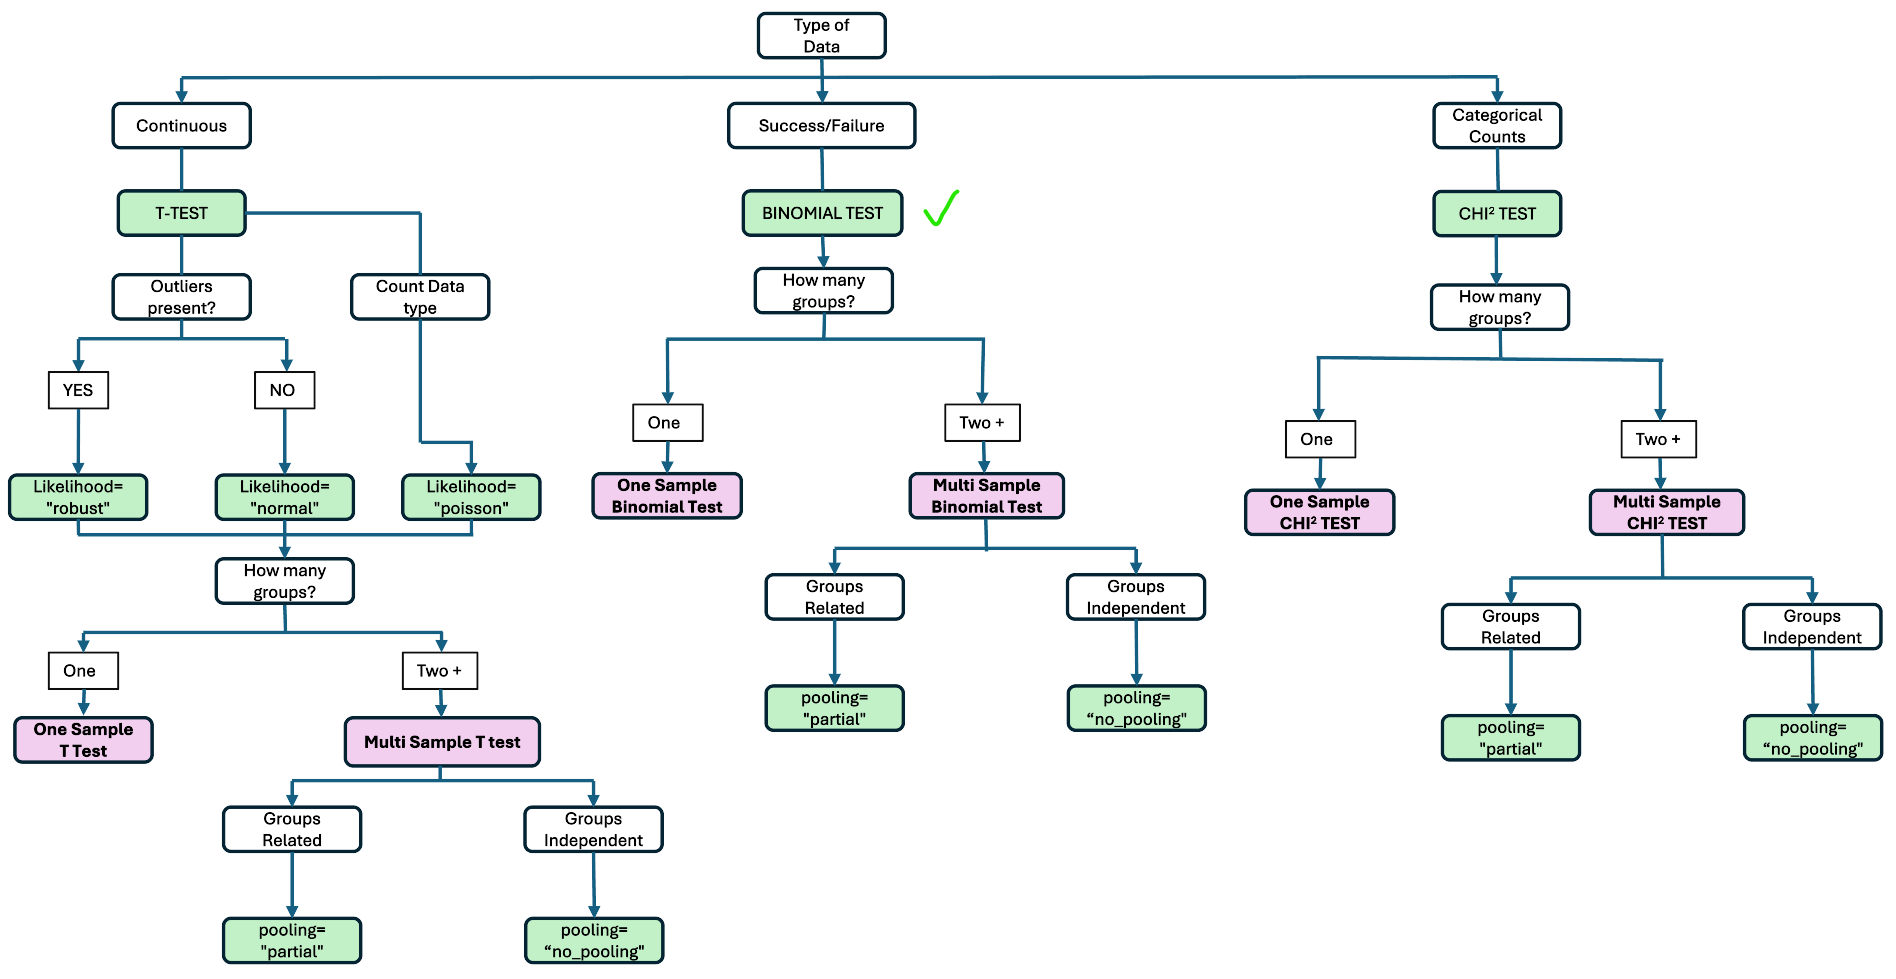
STEP 2: How many groups are you comparing?
-
ONE group vs reference value --> Complete Pooling
-
TWO groups or more --> Partial or No Pooling
-
-
STEP 3: Are your groups related or independent?
-
Related - Partial (RECOMMEND)
-
No related - No Pooling
-
Configuration Flow
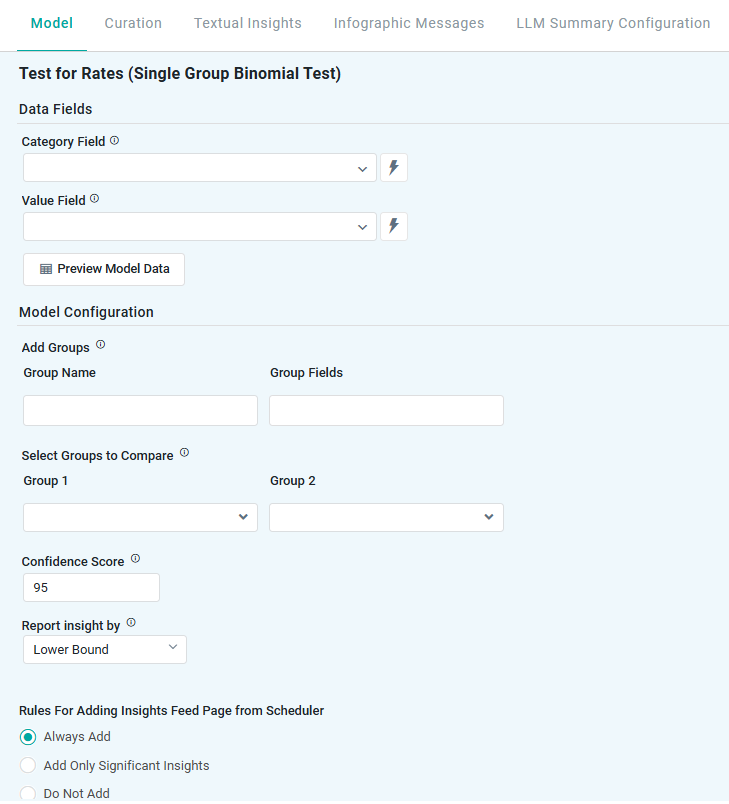
Single Group Binomial Test
Properties
|
Label |
UI |
Default |
Description |
|---|---|---|---|
|
Data Fields |
|
|
|
|
Dropdown w/Expression |
|
Represents non-numeric groupings (eg, product type, customer segment) used to compare differences across multiple samples. |
|
Dropdown w/Expression |
|
Represents the numerical data being tested, typically success or failure rates (eg, click-through rates, defect rates). |
|
Button |
|
Opens a dialog to view the data that will be used by the model. See Model > Model tab | Preview Model Data Dialog. |
|
Model Configuration |
|
|
|
|
Add Groups |
Repeater Section |
|
Allows users to define specific data segments (eg, different marketing campaigns, product variations) for separate analysis. |
|
Text Field |
|
|
|
Tags |
|
|
|
Select Groups to Compare |
Repeater Section |
|
Enables users to choose which predefined groups should be statistically compared to determine if their success rates significantly differ. |
|
Dropdown |
|
|
|
Dropdown |
|
|
|
Confidence Score |
Number Field |
95 |
Represents the range in which the true prediction is expected to fall, based on a chosen confidence level. For example, a 95% confidence level means there’s a 95% chance the actual value lies within that range. Users can adjust the confidence level (eg, 90 to 99), with higher levels widening the interval to reflect greater certainty. |
|
Report Insight By |
Dropdown |
Lower Bound |
Defines how insights are generated based on key statistical measures:
These metrics help businesses assess performance variations and make data-driven decisions. |
Multi Group Binomial Test
Properties
|
Label |
UI |
Default |
Description |
|---|---|---|---|
|
Data Fields |
|
|
|
|
Dropdown w/Expression |
|
Represents non-numeric groupings (eg, product type, customer segment) used to compare differences across multiple samples. |
|
Dropdown w/Expression |
|
The numerical data being analyzed (eg, sales, conversation rate) to test whether differences between groups are statistically significant. |
|
Button |
|
Opens a dialog to view the data that will be used by the model. See Model > Model tab | Preview Model Data Dialog. |
|
Model Configuration |
|
|
|
|
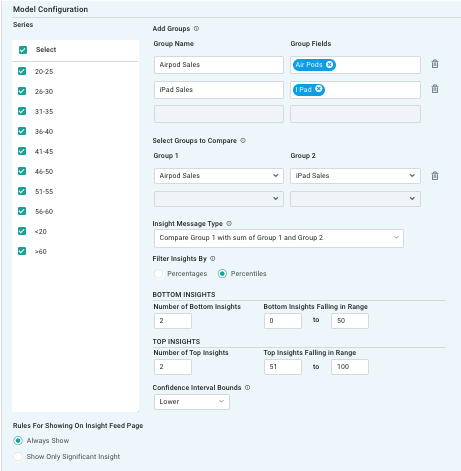
Checkboxes |
All selected |
|
|
Add Groups |
Repeater Section |
|
Allows users to define specific data segments (eg, regions, product lines) for separate analysis of success rates. |
|
Text Field |
|
|
|
Tags |
|
|
|
Select Groups to Compare |
Repeater Section |
|
Enables users to choose which predefined groups should be compared to determine if their success rates significantly differ. |
|
Dropdown |
|
|
|
Dropdown |
|
|
|
Insight Message Type |
Dropdown |
|
Defines how results are communicated (eg, summary insights, detailed statistical explanations) to help users interpret the findings. |
|
Filter Insights By |
Radio-buttons |
|
Allows users to refine the analysis based on specific criteria (eg, selecting only high-performing regions or filtering by threshold success rate). Options are:
|
|
Bottom Insights |
|
|
Bottom Insights - identifies categories with the lowest success rates (eg, underperforming stores or lowest response rates). |
|
Number Field |
2 |
|
|
Number Fields |
0-50 |
|
|
Top Insights |
|
|
Top Insights - highlights categories with the highest success rates (eg, top-performing products or highest engagement augments). |
|
Number Field |
2 |
|
|
Number Fields |
51-100 |
|
|
Confidence Interval Bounds |
Dropdown |
Lower |
Provides a range within which the true success rate is expected to fall, offering statistical certainty about the observed results.
|
|
Rules for Adding to Insights Feed Page from Scheduler |
Radio-buttons |
|
This section allows the user to select if the Quick Insight will be added to the Insights Feed page when generated from a Scheduled Task. See Model > Model tab | Rules for Adding Insights Feed Page from Scheduler. |
Contact App Orchid | Disclaimer