Intended audience: end-users developers
AO Platform: 4.5
Test for Means
The Model tab generally includes one or more of the following sections:
-
Data Fields - these are the data field configuration properties mandatory for the model to execute.
-
Model Specific Configurations - configuration properties in this section will vary depending on the selected model. If the model does not require additional configuration, the section(s) will not be shown.
Background
What?
-
A statistical method to compare means across groups using Bayesian inference.
-
KEY OUTPUT
-
Posterior distribution of each group's mean
-
Credible intervals (like confidence intervals, but interpretable!)
-
Direct probability statements: P(Group A > Group B) = 92%
-
Why?
-
INTUITIVE RESULTS ("There's an 87% probability that Region A outperforms Region B“)
-
UNCERTAINTY QUANTIFICATION (Get full distribution, not just point estimate)
-
WORKS WITH SMALL SAMPLES (Borrows strength across groups (partial pooling))
-
HANDLES REAL-WORLD DATA
-
Normal: Clean continuous data
-
Robust: Data with outliers
-
Poisson: Count data
-
-
FLEXIBLE POOLING STRATEGIES
-
Partial: Related groups (regions, time periods)
-
No Pooling: Independent groups (different products)
-
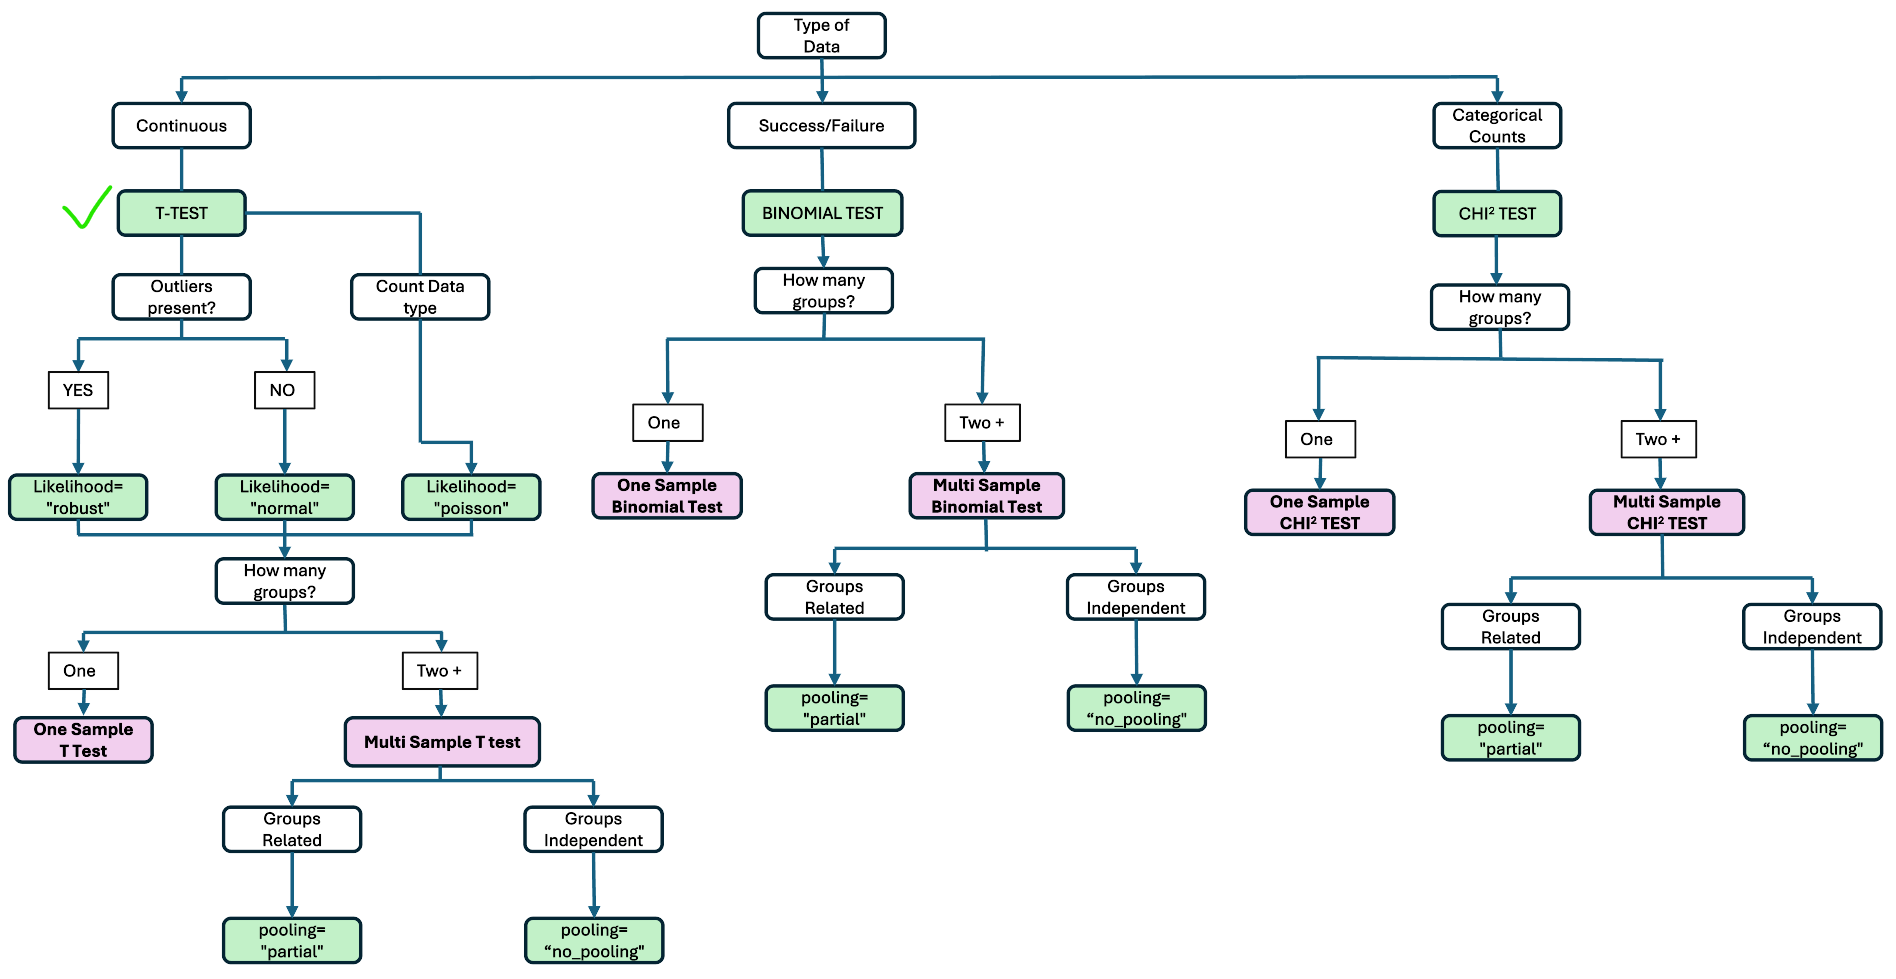
How?
-
STEP 1: How many groups are you comparing?
-
ONE group vs reference value - Complete Pooling
-
MULTIPLE groups - Partial or No Pooling
-
-
STEP 2: Are your groups related or independent?
-
STEP 3: What type of data do you have?
-
Clean continuous – Normal
-
With outliers - Robust
-
Count data - Poisson
-
|
Likelihood |
Data Type |
.scale() |
Reverse_scale |
Insights Key |
|---|---|---|---|---|
|
Normal |
Continuous |
YES |
True |
group_means / mu |
|
Robust |
Continuous + Outliers |
YES |
True |
group_means / mu |
|
Poisson |
Counts |
NO |
False |
group_means/ rate |
|
Pooling |
Use When |
Groups Share Info? |
Example |
|---|---|---|---|
|
Complete |
1 group |
N/A (single) |
Store vs benchmark |
|
Partial |
Related groups |
YES (hierarchical) |
Regions, time periods |
|
No Pooling |
Independent |
NO (separate) |
Different products |
Configuration Flow
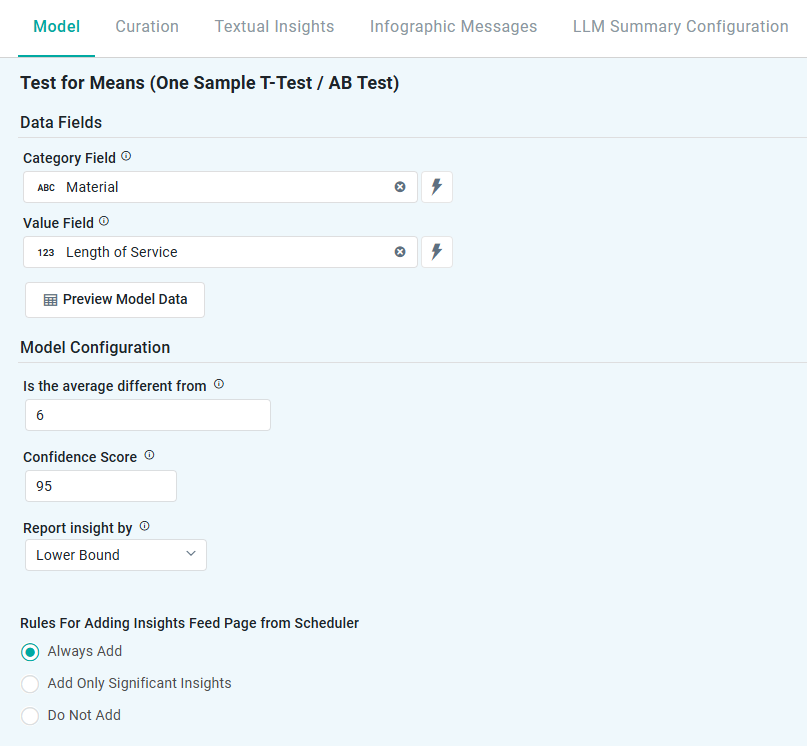
One Sample T-Test
Properties
|
Label |
UI |
Default |
Description |
|---|---|---|---|
|
Data Fields |
|
|
|
|
Dropdown w/Expression |
|
Represents non-numeric groupings (eg, product type, customer segment) used to compare differences across multiple samples. |
|
Dropdown w/Expression |
|
Contains the numerical data being tested (eg, average sales, customer ratings) to determine if the sample mean is significantly different from a given value. |
|
Button |
|
Opens a dialog to view the data that will be used by the model. See Model > Model tab | Preview Model Data Dialog. |
|
Model Configuration |
|
|
|
|
Number Field |
|
The benchmark value against which the sample mean is compared, to identify significant deviations. |
|
Number Field |
95 |
Represents the range in which the true prediction is expected to fall, based on a chosen confidence level. For example, a 95% confidence level means there’s a 95% chance the actual value lies within that range. Users can adjust the confidence level (eg, 90 to 99), with higher levels widening the interval to reflect greater certainty. |
|
Dropdown |
Lower Bound |
Defines how insights are generated based on key statistical measures:
|
|
Rules for Adding to Insights Feed Page from Scheduler |
Radio-buttons |
|
This section allows the user to select if the Quick Insight will be added to the Insights Feed page when generated from a Scheduled Task. See Model > Model tab | Rules for Adding Insights Feed Page from Scheduler. |
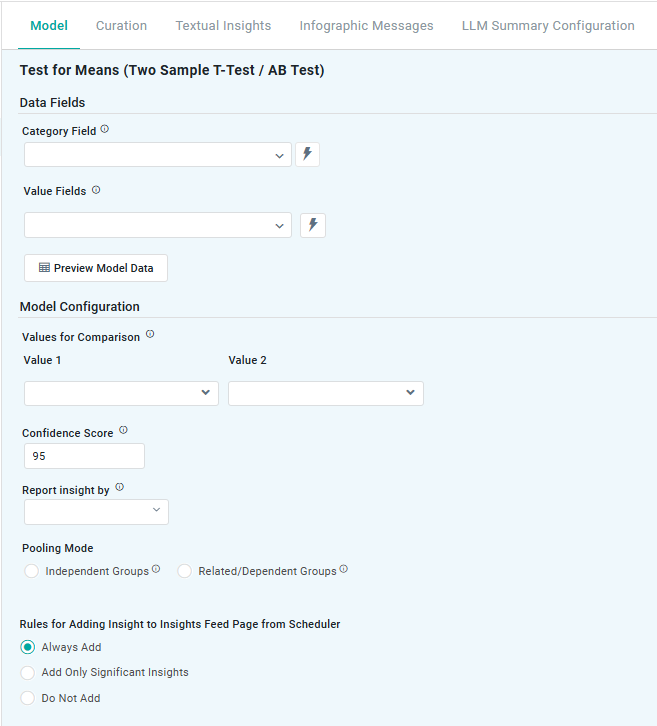
Two Sample T-Test / AB Test
Properties
|
Label |
UI |
Default |
Description |
|---|---|---|---|
|
Data Fields |
|
|
|
|
Dropdown w/Expression |
|
Represents non-numeric groupings (eg, product type, customer segment) used to compare differences across multiple samples. |
|
Dropdown w/Expression |
|
Contains the numerical data being tested (eg, revenue, customer satisfaction scores) to compare the means of two distinct groups. |
|
Button |
|
Opens a dialog to view the data that will be used by the model. See Model > Model tab | Preview Model Data Dialog. |
|
Model Configuration |
|
|
|
|
Repeater Section |
|
Defines the two data sets being analyzed to determine if there is a statistically significant difference between their mean values. |
|
Dropdown |
|
|
|
Dropdown |
|
|
|
Number Field |
95 |
Represents the range in which the true prediction is expected to fall, based on a chosen confidence level. For example, a 95% confidence level means there’s a 95% chance the actual value lies within that range. Users can adjust the confidence level (eg, 90 to 99), with higher levels widening the interval to reflect greater certainty. |
|
Dropdown |
Lower Bound |
Defines how insights are generated based on key statistical measures:
|
|
Radio-buttons |
|
Select the desired Pooling Mode:
|
|
Rules for Adding to Insights Feed Page from Scheduler |
Radio-buttons |
|
This section allows the user to select if the Quick Insight will be added to the Insights Feed page when generated from a Scheduled Task. See Model > Model tab | Rules for Adding Insights Feed Page from Scheduler. |
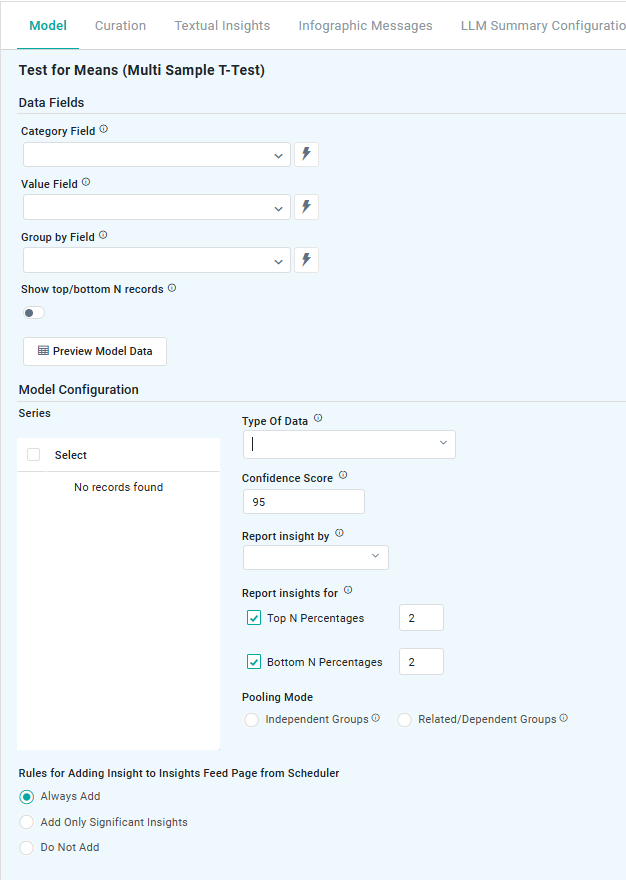
Multi Sample T-Test
Properties
|
Label |
UI |
Default |
Description |
|---|---|---|---|
|
Data Fields |
|
|
|
|
Dropdown w/Expression |
|
Represents non-numeric groupings (eg, product type, customer segment) used to compare differences across multiple samples. |
|
Dropdown w/Expression |
|
Contains the numerical data being tested (eg, average sales, customer ratings) to determine if the sample mean is significantly different from a given value. |
|
Dropdown w/Expression |
|
|
|
ON/OFF Toggle |
OFF |
Enable to show only the Top or Bottom N number of Records. |
|
Number Field |
|
Select the number of records to show if Show Top/Bottom N Records is enabled. |
|
ON/OFF Toggle |
OFF |
Enable to also show the Other category as a sum of remaining records if Show Top/Bottom N Records is enabled. |
|
Button |
|
Opens a dialog to view the data that will be used by the model. See Model > Model tab | Preview Model Data Dialog. |
|
Model Configuration |
|
|
|
|
Checkboxes |
All selected |
|
|
Dropdown |
Data is Normal |
Select the Type of Data from either of the following options:
|
|
Number Field |
95 |
Represents the range in which the true prediction is expected to fall, based on a chosen confidence level. For example, a 95% confidence level means there’s a 95% chance the actual value lies within that range. Users can adjust the confidence level (eg, 90 to 99), with higher levels widening the interval to reflect greater certainty. |
|
Dropdown |
Lower Bound |
Defines how insights are generated based on key statistical measures:
|
|
Checkboxes |
2 |
This setting allows users to focus on the Top N or Bottom N categories based on their proportions. Top N - highlights the categories with the highest proportions (eg, top-performing products or highest conversion rates). Bottom N - identifies the categories with the lowest proportions (eg, underperforming regions or lowest customer engagement). |
|
Radio-buttons |
|
Select the desired Pooling Mode:
|
|
Rules for Adding to Insights Feed Page from Scheduler |
Radio-buttons |
|
This section allows the user to select if the Quick Insight will be added to the Insights Feed page when generated from a Scheduled Task. See Model > Model tab | Rules for Adding Insights Feed Page from Scheduler. |
Single Series T-Test (One Sample Data to Two Groups)
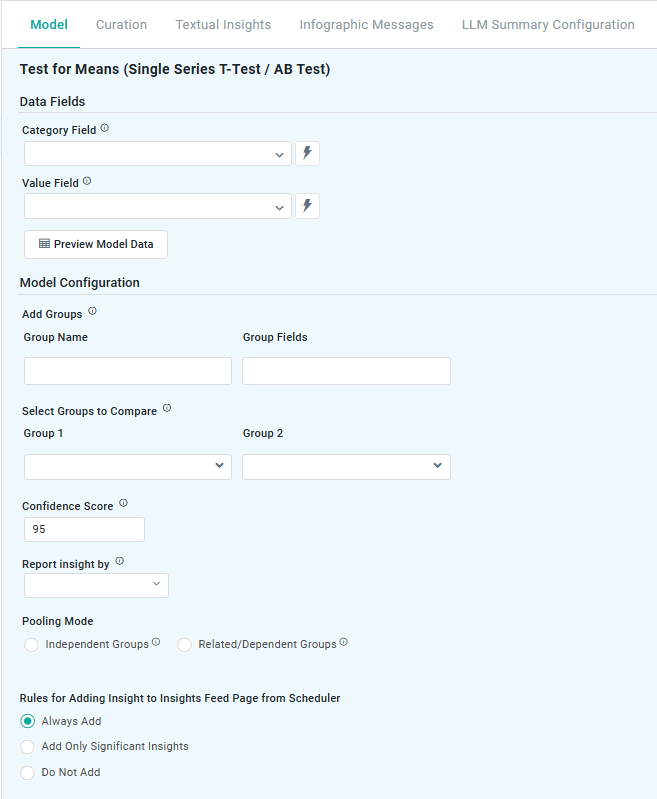
Properties
|
Label |
UI |
Default |
Description |
|---|---|---|---|
|
Data Fields |
|
|
|
|
Dropdown w/Expression |
|
Represents non-numeric groupings (eg, product type, customer segment) used to compare differences across multiple samples. |
|
Dropdown w/Expression |
|
Contains the numerical data being tested (eg, average sales, customer ratings) to determine if the sample mean is significantly different from a given value. |
|
Button |
|
Opens a dialog to view the data that will be used by the model. See Model > Model tab | Preview Model Data Dialog. |
|
Model Configuration |
|
|
|
|
Add Groups |
Repeater Section |
|
Allows users to define specific data segments (eg, customer segments, product categories) for separate analysis, helping compare mean values across different groups. |
|
Text Field |
|
|
|
Tags |
|
|
|
Select Groups to Compare |
Repeater Section |
|
Enables users to choose which predefined groups should be statistically compared, determining whether their mean values are significantly different from each other. |
|
Dropdown |
|
|
|
Dropdown |
|
|
|
Number Field |
95 |
Represents the range in which the true prediction is expected to fall, based on a chosen confidence level. For example, a 95% confidence level means there’s a 95% chance the actual value lies within that range. Users can adjust the confidence level (eg, 90 to 99), with higher levels widening the interval to reflect greater certainty. |
|
Dropdown |
Lower Bound |
Defines how insights are generated based on key statistical measures:
|
|
Radio-buttons |
|
Select the desired Pooling Mode:
|
|
Rules for Adding to Insights Feed Page from Scheduler |
Radio-buttons |
|
This section allows the user to select if the Quick Insight will be added to the Insights Feed page when generated from a Scheduled Task. See Model > Model tab | Rules for Adding Insights Feed Page from Scheduler. |
Contact App Orchid | Disclaimer