Intended audience: analysts developers administrators
AO Platform: 4.5
Overview
This section contains the option to generate statistics for the data from the MSO. Statistics can only be generated for MSO where MSO Sourcing has been configured. Statistics are used by the AI components and the Easy Answers solution in the AO Platform, as well as providing immediate visual feedback on the type of data available for each Property field in the MSO. The Statistics are based on the Data Type of the field properties, such as String, Number (Integer, Double, …), Date, Boolean, and Geometry.
Properties
|
Type |
Description |
String |
Number |
Date |
Boolean |
Geometry |
|---|---|---|---|---|---|---|
|
Null |
Number of records that have no value. |
Yes |
Yes |
Yes |
Yes |
Yes |
|
Not Null |
Number of records that have a value. |
Yes |
Yes |
Yes |
Yes |
Yes |
|
Complete |
Indicates in percentage if there are any missing values for a given field property. |
Yes |
Yes |
Yes |
Yes |
Yes |
|
Min |
The lowest number value for the property. |
|
Yes |
|
|
|
|
Max |
The highest number value for the property. |
|
Yes |
|
|
|
|
Min Length |
The minimum length of string values for the property. |
Yes |
|
|
|
|
|
Max Length |
The maximum length of string values for the property. |
Yes |
|
|
|
|
|
Min Date |
The oldest date for the property value. |
|
|
Yes |
|
|
|
Max Date |
The most recent date for the property value. |
|
|
Yes |
|
|
|
Cardinality |
Indicates how similar or dissimilar the data for a given field property is (Very Low, Low, Normal, High, Very High), eg. Very low means that the value of most data records for the field is the same, or represent only a small number of categories, - conversely, Very High means that most data records for the field are unique. See reference. |
Yes |
Yes |
Yes |
Yes |
Yes |
|
Unique |
Number of unique values for the property. |
Yes |
Yes |
Yes |
Yes |
Yes |
|
Variance |
The average of the squared differences from the Mean (the simple average of the numbers). See reference. |
|
Yes |
|
Yes |
|
|
True |
Number of records with a True value. |
|
|
|
Yes |
|
|
False |
Number of records with a False value. |
|
|
|
Yes |
|
|
Standard Deviation |
A measure of how spread out the numbers are. See reference. |
|
Yes |
|
|
|
|
Sum |
The Sum of all values for the property. |
|
Yes |
|
|
|
|
Skewness |
A number showing the distribution of all values for the property. A value between 0 and 0.5 is considered to be a “negative skew”, whereas a value between 0.5 and 1 is considered a “positive skew”. See reference. |
|
Yes |
|
|
|
|
Kurtosis |
See reference. |
|
Yes |
|
|
|
|
Median |
See reference. |
|
Yes |
|
|
|
|
Percentile 25 |
See reference. |
|
Yes |
|
|
|
|
Percentile 50 |
See reference. |
|
Yes |
|
|
|
|
Percentile 75 |
See reference. |
|
Yes |
|
|
|
|
Percentile 90 |
See reference. |
|
Yes |
|
|
|
|
Zero Value Count |
Number of records for the property with a Zero value. |
|
Yes |
|
|
|
|
Average |
See reference. |
|
Yes |
|
|
|
|
Negative Value Count |
Number of records for the property with Negative values. |
|
Yes |
|
|
|
|
Mode |
See reference. |
|
Yes |
|
|
|
Additionally, visualizations will be shown for…
-
Top 5 - a chart showing the top 5 values in the data
-
Data Distribution - shows a chart/map to indicate how data is distributed - over time (for Date data type) and on a map (for Geometry data type)
-
Word Cloud - shows the top 50 words in the data (for string data types)
-
Samples - shows up to 50 random values in the data
The Statistics page does not require input in order for the Statistics to be created. Statistics on this page are created for all available Property fields in the MSO individually.
User Actions
-
Create Statistics - if no Statistics have been created, click the Get Statistics button. Statistics can also be created in bulk for all MSOs with Sourcing and belonging to the same Ontology - see Creating an Ontology | actions on individual ontologies.
-
Update Statistics - use this option to update the previously created Statistics in case the data source has substantially changed. See MSO - Statistics | Update Statistics.
-
Delete Statistics - use this option to delete Statistics from an MSO. Statistics can also be deleted in bulk for all MSOs with Sourcing and belonging to the same Ontology - see Creating an Ontology | actions on individual ontologies.
-
View Statistics - the rest of the Statistics page includes various insights into the Statistics created for each Property field in the MSO - see table below.
Video
Properties
|
Label |
Description |
|---|---|
|
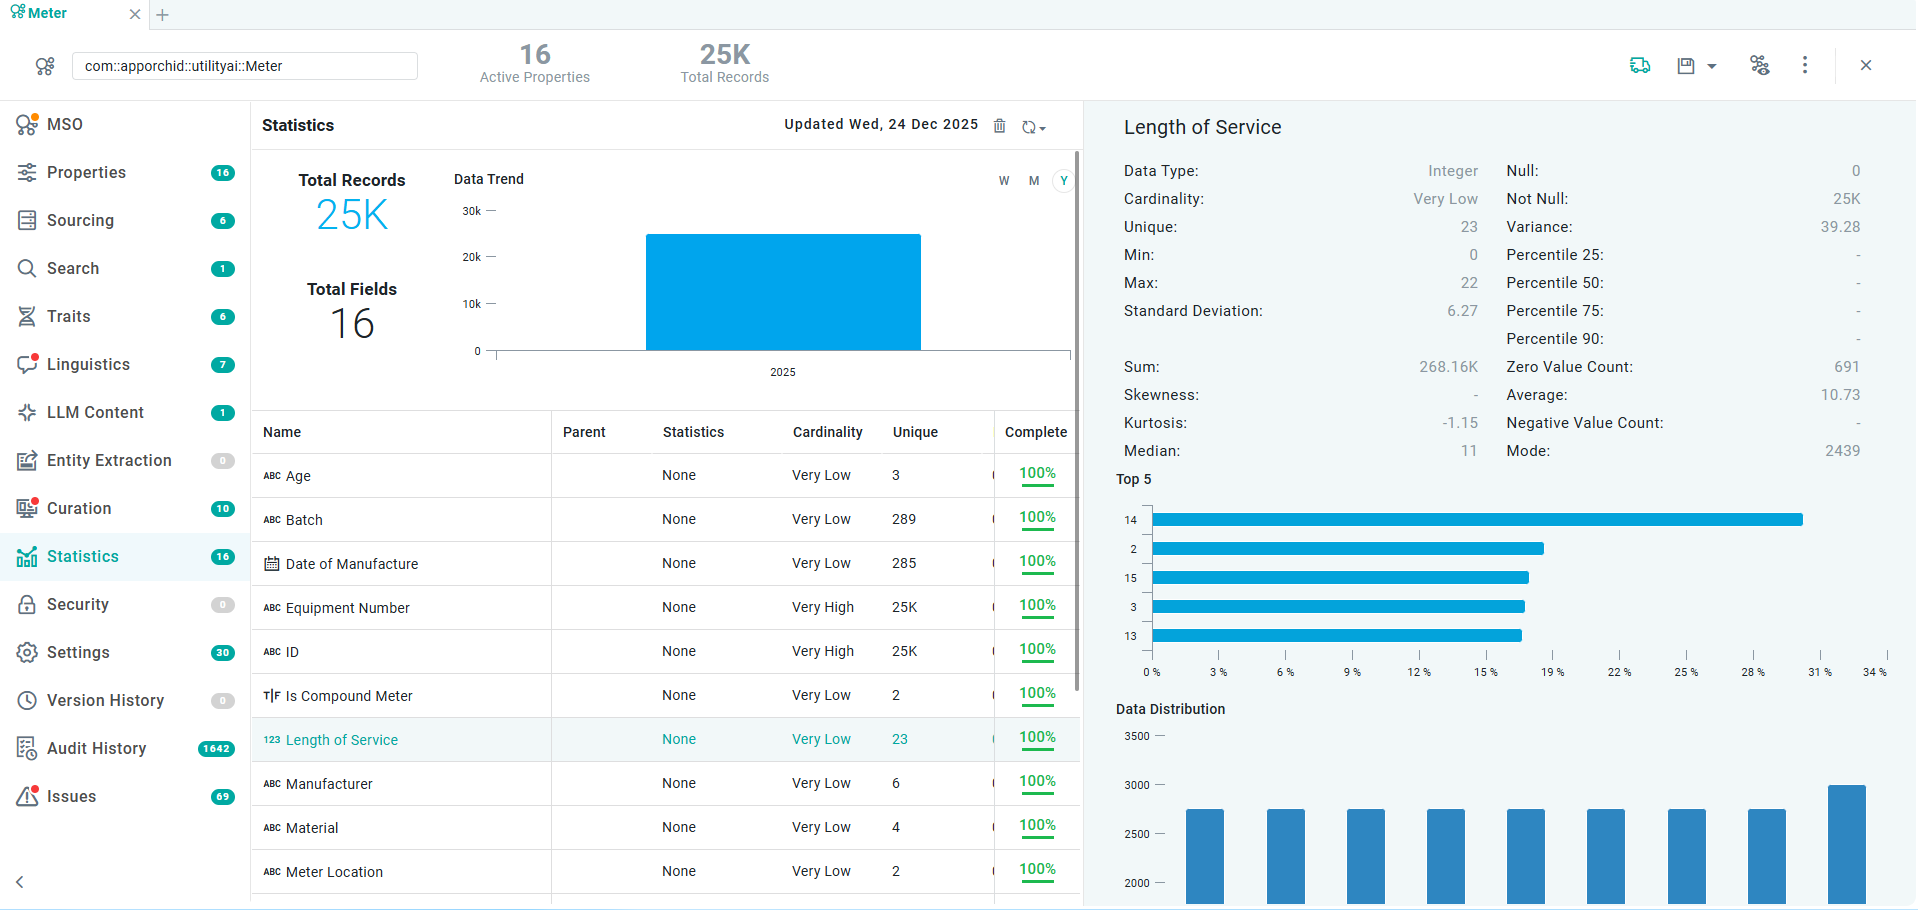
Statistics for MSO - Chart |
The Chart view displays the total number of Records (columns) and Fields (lines) available in the data source for different time periods (Weeks, Months, and Years). |
|
List of field Properties |
The Property fields list view displays basic attributes of each Property field, such as Data Type and Parent, as well as the generated Statistics, including Cardinality, Uniqueness, and Null values. |
|
Statistics for individual MSO field Properties - Charts |
On clicking on a field Property, the right-side panel displays additional Statistics for the selected Property. What is displayed depends on the Data Type of the field Property and will include summary charts, e.g., Top 5, Data Distribution, True vs. False values, Word Cloud, etc. Finally, up to 50 data Samples are shown. |
Update Statistics
-
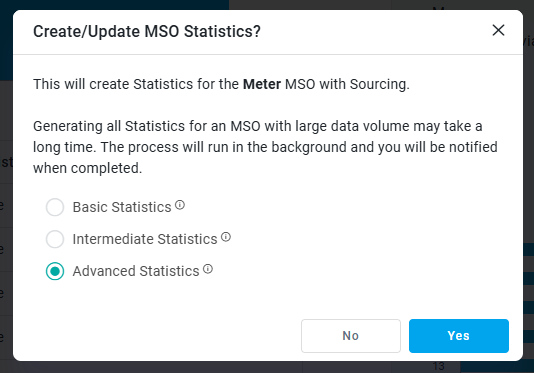
Update Statistics - use to update all previously created statistics for all field properties in the current MSO. A pop-up will alert the user to the potential of this operation taking a long time in case of many MSO field properties and/or large data volumes. Select Basic or Intermediate Statistics to generate fewer statistics if not all statistics are required. See Statistics Levels.
-
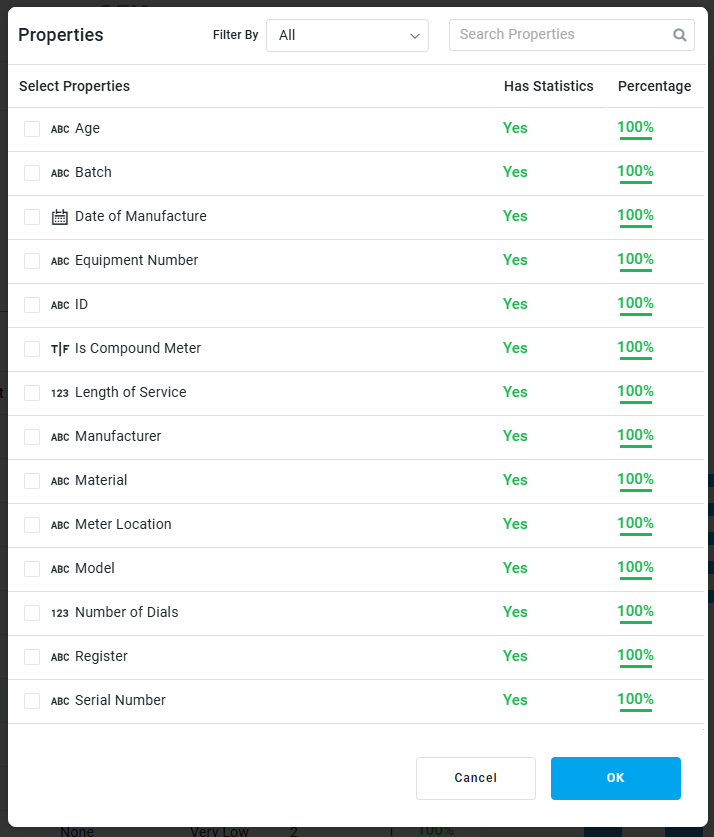
Select Properties - use this to open a pop-up dialog from which the user can select individual field properties for which statistics will be updated.
Contact App Orchid | Disclaimer