Intended audience: end-users analysts developers administrators
AO Platform: 4.4
Overview
This topic provides an overview of a Dependency Wheel Chart. A Dependency Wheel Chart is a circular visualization displaying relationships or dependencies between different categories or elements. It is beneficial for analyzing flows, connections, or hierarchies in datasets.
Example
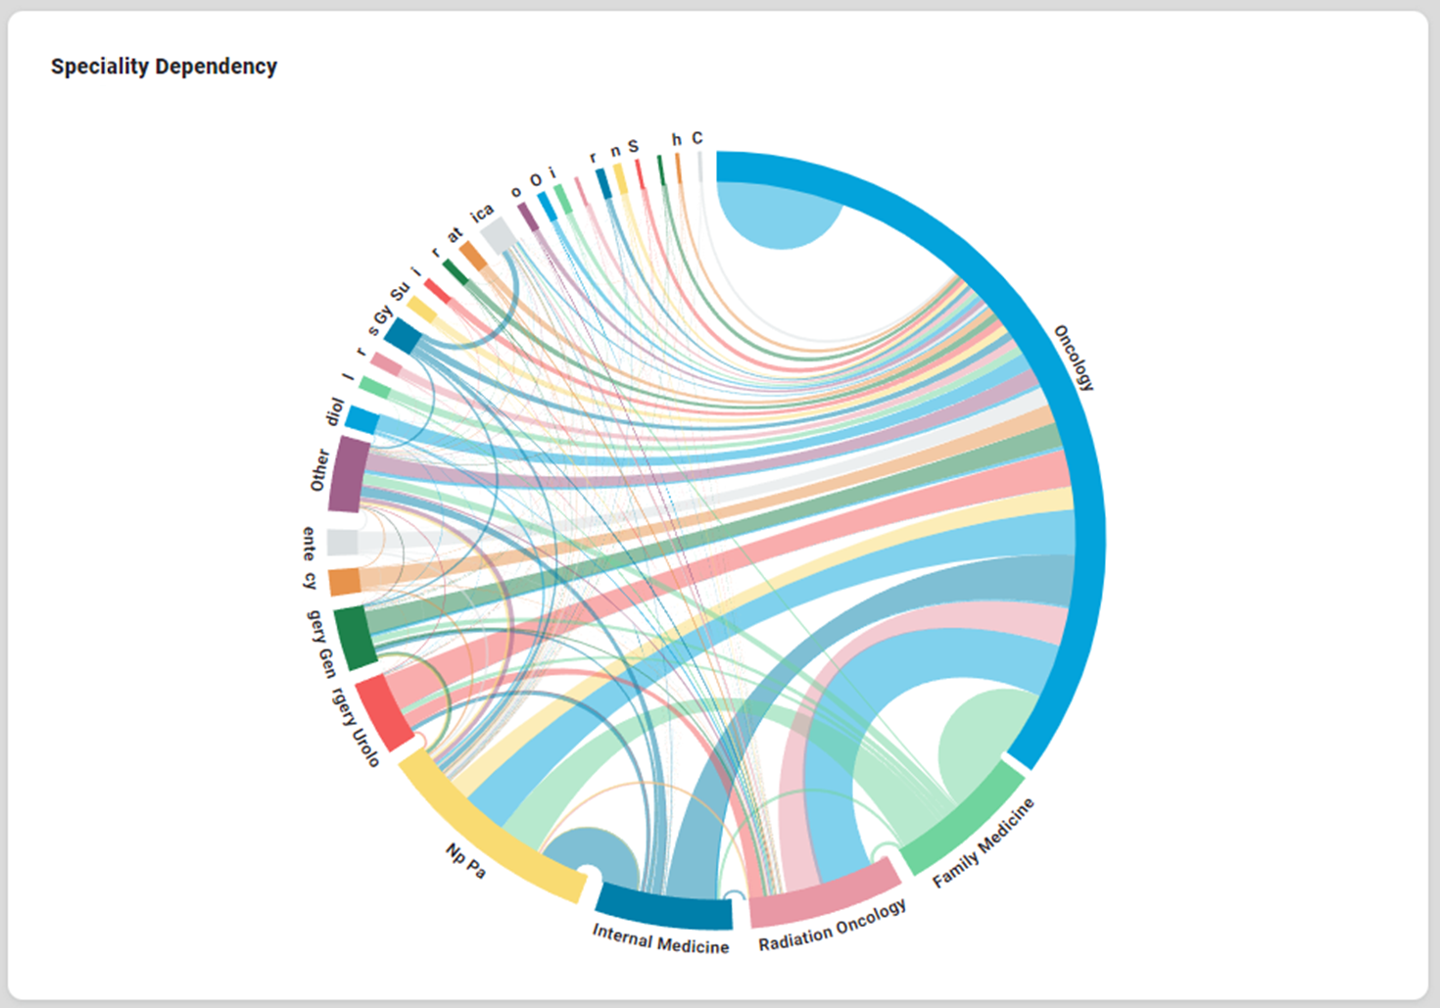
Configuration of Dependency Wheel Chart
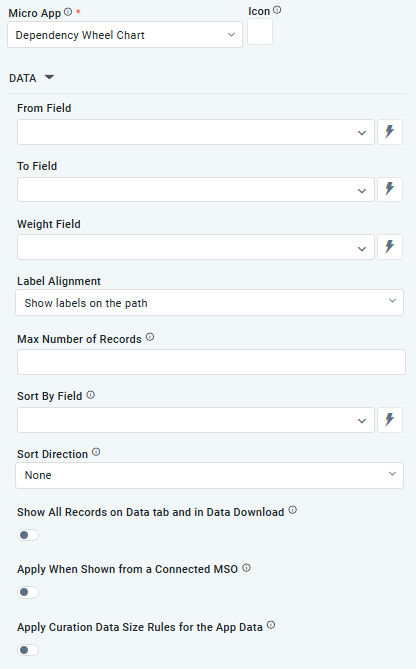
DATA Properties
|
Label |
UI Widget |
Default |
Description |
|---|---|---|---|
|
From Field |
Dropdown w/Expression option |
|
The From field dropdown allows the user to select a specific column or attribute in the dataset that represents the source of a dependency or relationship. |
|
To Field |
Dropdown w/Expression option |
|
The To field dropdown allows the user to select a specific column or attribute in the dataset that represents the endpoint of a dependency or relationship |
|
Weight Field |
Dropdown w/Expression option |
|
The Weight Field dropdown allows the user to select a specific column or attribute in the dataset that quantifies the strength, intensity, or significance of the relationship between the From Field (source) and the To Field (endpoint). |
|
Label Alignment |
Dropdown |
|
The Label Alignment allows the user to select an option from Do not show labels, Show labels, Labels on the path. |
|
Max no. of records |
Number Field |
|
Option to set a Max number of records to be used by the Chart. |
|
Sort By Field |
Dropdown w/Expression option |
|
The Sort By Field option allows users to select a field to sort the data and also provides the flexibility to define a custom expression for more advanced sorting criteria. |
|
Sort Direction |
Dropdown |
|
Option to set Sort order for data in the Chart to either Ascending or Descending. |
|
ON/OFF Toggle |
OFF |
If enabled, all records, otherwise excluded by the LIMIT clause when “Show TopN Plus Other” is enabled, and used by the App, will be shown on the App’s Data tab as well as in the Download Data option. |
|
Apply when shown from a Connected MSO |
ON/OFF Toggle |
OFF |
The Apply When Shown from a Connected MSO ON/OFF Toggle determines whether the settings or actions are applied specifically when data is displayed through a connected MSO.
|
|
Apply Curation Data Size Rules for the App Data |
ON/OFF Toggle |
OFF |
If enabled, the Record Count rules will be applied. If the Record Count rules are not met, the series will not be shown. |
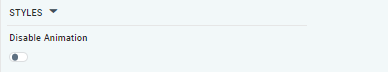
STYLES Properties
|
Label |
UI Widget |
Default |
Description |
|---|---|---|---|
|
ON/OFF Toggle |
OFF |
The Disable Animation toggle refers to turning off any animated transitions or effects that occur when the chart or visualization is rendered or updated. |
Contact App Orchid | Disclaimer