Intended audience: analysts developers administrators
AO Platform: 4.3
Overview
-
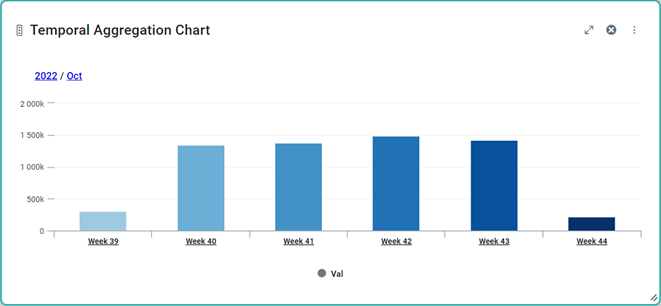
This trait is used for data where there is a continuous stream of values like an IOT use case where the current power consumption is sent every second. Instead of showing every single data point, the data can be aggregated over time when returned and the resulting visualization, eg. a Server Side Temporal Aggregation Chart, allows the user to drill down through different levels of aggregations, such as Year, Month, Week, Day.
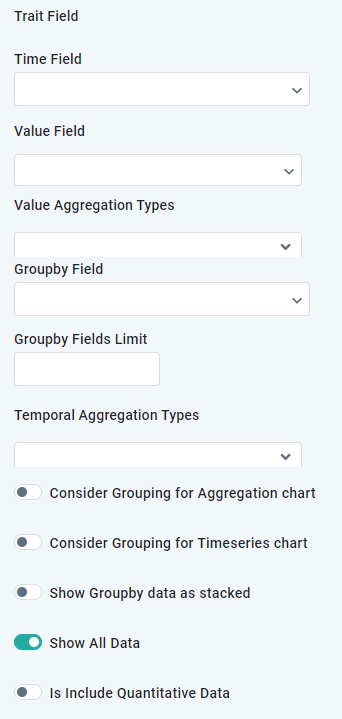
Trait Fields
|
Label |
UI Widget |
Defaults |
Description |
|---|---|---|---|
|
Time Field |
Dropdown |
|
Add a Property Field containing date/time value. |
|
Value Field |
Dropdown |
|
Add one or more Value Fields (repeater) containing property values to be displayed for each date/time value, eg. a Meter Reading. |
|
Value Aggregation Types |
Dropdown |
|
Add one or more Value Aggregation Types (repeater), including Avg, Count, Countdistinct, Expression, Max, Min, Stddev, Stddevpop, Sum, and Variance. The Value Aggregation Type is used by the following charts: Server Side Temporal Aggregation Chart, Server Side Timeseries Chart and Server Side Calender Heatmap Chart. |
|
Groupby Field |
Dropdown |
|
Add a Property Field by which the data will be grouped. This property is only used in the Calendar Heatmap Chart when drilled down to the Daily View. |
|
Groupby Fields Limit |
Number |
|
|
|
Temporal Aggregation Types |
Dropdown |
|
Options include: Day, Month, Month And Year, Quarter, Quarter And Year, Week, and Year |
|
Consider Grouping for Aggregation Chart |
ON/OFF Toggle |
OFF |
|
|
Consider Grouping for Timeseries Chart |
ON/OFF Toggle |
OFF |
|
|
Show Groupby Data as Stacked |
ON/OFF Toggle |
OFF |
|
|
Show All Data |
ON/OFF Toggle |
ON |
|
|
Is Include Quantitative Data |
ON/OFF Toggle |
OFF |
|
Example Visualization
Contact App Orchid | Disclaimer