Intended audience: end-users analysts developers administrators
AO Platform: 4.3
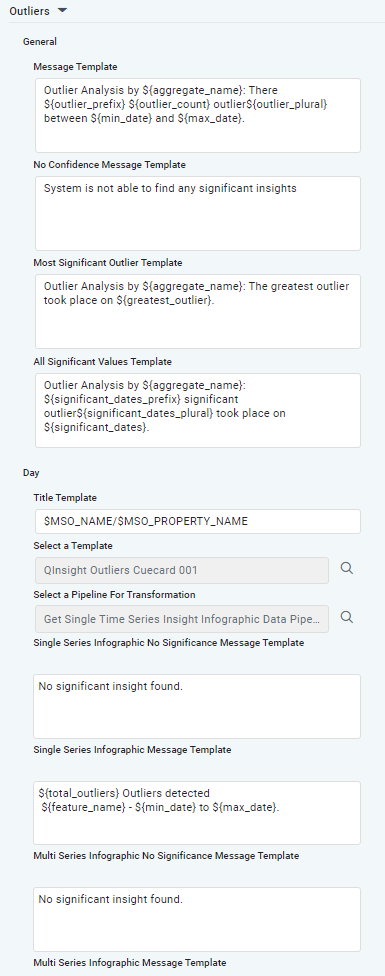
Properties for Insights > Outliers
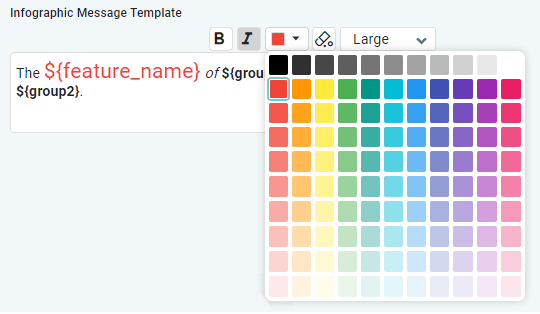
Formatting of Infographic Message Template
Some multi-line text field properties have additional formatting options. These properties are related to the Infographic card templates. Options include:
-
B - select some text, then click B to turn selected text Bold
-
I - select some text, then click I to turn selected text Italics
-
Color - select some text, then click dropdown to select a color
-
Clear - click to clear all existing formatting of the text
-
Font - select some text, then click dropdown to select font-size (small, medium, large)
|
Label |
Type |
Default Value |
Description |
|---|---|---|---|
|
Day |
|
|
|
|
Text Field |
$INSIGHT_TYPE - $MSO_NAME/$MSO_PROPERTY_NAME for $RUNTIME_LABEL |
Available variables
|
|
Search Dialog |
QInsight Outliers Cuecard 001 |
Use Search dialog to select a Quick Insight Template. |
|
Search Dialog |
Get Single Time Series Insight Infographic Data Pipeline |
Use Search dialog to select a Pipeline that will transform input data into a suitable format for the Quick Insight model (optional). |
|
Multiline Text Field with formatting options |
No significant insight found. |
Single Series Template for the Infographic card - no significance. |
|
Multiline Text Field with formatting options |
${total_outliers} Outliers detected ${feature_name} - ${min_date} to ${max_date}. |
Single Series Template for the Infographic card. |
|
Multiline Text Field with formatting options |
No significant insight found. |
Multi Series Template for the Infographic card - no significance. |
|
Multiline Text Field with formatting options |
${total_outliers} Outliers detected ${feature_name} - ${min_date} to ${max_date}. |
Multi Series Template for the Infographic card. |
|
Week |
|
|
|
|
Text Field |
$INSIGHT_TYPE - $MSO_NAME/$MSO_PROPERTY_NAME for $RUNTIME_LABEL |
Available variables
|
|
Search Dialog |
QInsight Outliers Cuecard 001 |
Use Search dialog to select a Quick Insight Template. |
|
Search Dialog |
Get Single Time Series Insight Infographic Data Pipeline |
Use Search dialog to select a Pipeline that will transform input data into a suitable format for the Quick Insight model (optional). |
|
Multiline Text Field with formatting options |
No significant insight found. |
Single Series Template for the Infographic card - no significance. |
|
Multiline Text Field with formatting options |
${total_outliers} Outliers detected ${feature_name} - ${min_date} to ${max_date}. |
Single Series Template for the Infographic card. |
|
Multiline Text Field with formatting options |
No significant insight found. |
Multi Series Template for the Infographic card - no significance. |
|
Multiline Text Field with formatting options |
${total_outliers} Outliers detected ${feature_name} - ${min_date} to ${max_date}. |
Multi Series Template for the Infographic card. |
|
Month |
|
|
|
|
Text Field |
$INSIGHT_TYPE - $MSO_NAME/$MSO_PROPERTY_NAME for $RUNTIME_LABEL |
Available variables
|
|
Search Dialog |
QInsight Outliers Cuecard 001 |
Use Search dialog to select a Quick Insight Template. |
|
Search Dialog |
Get Single Time Series Insight Infographic Data Pipeline |
Use Search dialog to select a Pipeline that will transform input data into a suitable format for the Quick Insight model (optional). |
|
Multiline Text Field with formatting options |
No significant insight found. |
Single Series Template for the Infographic card - no significance. |
|
Multiline Text Field with formatting options |
${total_outliers} Outliers detected ${feature_name} - ${min_date} to ${max_date}. |
Single Series Template for the Infographic card. |
|
Multiline Text Field with formatting options |
No significant insight found. |
Multi Series Template for the Infographic card - no significance. |
|
Multiline Text Field with formatting options |
${total_outliers} Outliers detected ${feature_name} - ${min_date} to ${max_date}. |
Multi Series Template for the Infographic card. |
|
Quarter |
|
|
|
|
Text Field |
$INSIGHT_TYPE - $MSO_NAME/$MSO_PROPERTY_NAME for $RUNTIME_LABEL |
Available variables
|
|
Search Dialog |
QInsight Outliers Cuecard 001 |
Use Search dialog to select a Quick Insight Template. |
|
Search Dialog |
Get Single Time Series Insight Infographic Data Pipeline |
Use Search dialog to select a Pipeline that will transform input data into a suitable format for the Quick Insight model (optional). |
|
Multiline Text Field with formatting options |
No significant insight found. |
Single Series Template for the Infographic card - no significance. |
|
Multiline Text Field with formatting options |
${total_outliers} Outliers detected ${feature_name} - ${min_date} to ${max_date}. |
Single Series Template for the Infographic card. |
|
Multiline Text Field with formatting options |
No significant insight found. |
Multi Series Template for the Infographic card - no significance. |
|
Multiline Text Field with formatting options |
${total_outliers} Outliers detected ${feature_name} - ${min_date} to ${max_date}. |
Multi Series Template for the Infographic card. |
|
Year |
|
|
|
|
Text Field |
$INSIGHT_TYPE - $MSO_NAME/$MSO_PROPERTY_NAME for $RUNTIME_LABEL |
Available variables
|
|
Search Dialog |
QInsight Outliers Cuecard 001 |
Use Search dialog to select a Quick Insight Template. |
|
Search Dialog |
Get Single Time Series Insight Infographic Data Pipeline |
Use Search dialog to select a Pipeline that will transform input data into a suitable format for the Quick Insight model (optional). |
|
Multiline Text Field with formatting options |
No significant insight found. |
Single Series Template for the Infographic card - no significance. |
|
Multiline Text Field with formatting options |
${total_outliers} Outliers detected ${feature_name} - ${min_date} to ${max_date}. |
Single Series Template for the Infographic card. |
|
Multiline Text Field with formatting options |
No significant insight found. |
Multi Series Template for the Infographic card - no significance. |
|
Multiline Text Field with formatting options |
${total_outliers} Outliers detected ${feature_name} - ${min_date} to ${max_date}. |
Multi Series Template for the Infographic card. |
|
Message Template |
Multiline Text Field |
Outlier Analysis by ${aggregate_name}: There ${outlier_prefix} ${outlier_count} outlier${outlier_plural} between ${min_date} and ${max_date}. |
Template for Textual Insight, including the data variables that will be added into template at runtime. Variables available
|
|
Most Significant Outlier Template |
Multiline Text Field |
Outlier Analysis by ${aggregate_name}: The greatest outlier took place on ${greatest_outlier}. |
Template for Textual Insight, including the data variables that will be added into template at runtime. Variables available
|
|
All Significant Values Template |
Multiline Text Field |
Outlier Analysis by ${aggregate_name}: ${significant_dates_prefix} significant outlier${significant_dates_plural} took place on ${significant_dates}. |
Template for Textual Insight, including the data variables that will be added into template at runtime. Variables available
|
Contact App Orchid | Disclaimer