Intended audience: end-users analysts developers administrators
AO Platform: 4.3
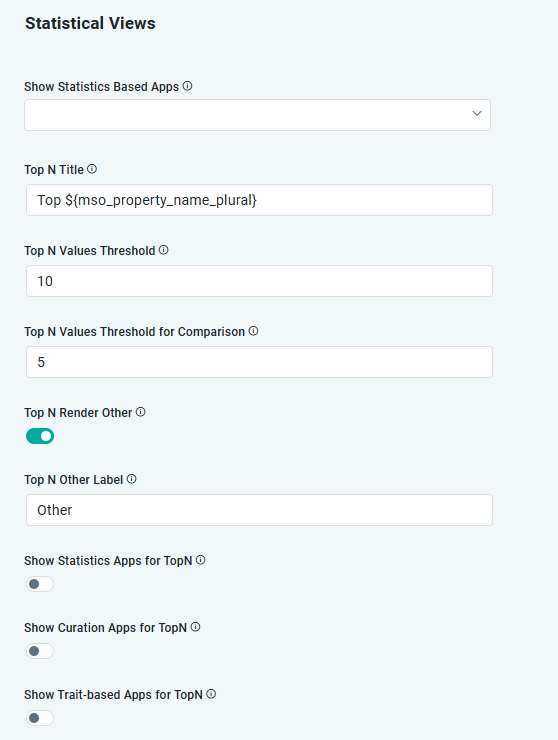
Properties for Easy Answers > Statistical Views
|
Label |
Type |
Default Value |
Description |
|---|---|---|---|
|
True/False Dropdown |
“empty” |
If enabled, Statistics based Apps will be shown. |
|
String |
Top N |
Show this Title for Top N charts. Both absolute text and variables can be used to form a Title, including: {mso_name}, {mso_name_plural}, {related_mso_name}, {related_mso_name_plural}, {mso_property_name}, and {mso_property_name_plural}. |
|
Number |
10 |
Maximum records in Top N charts after which Top N charts will be shown in Statistics screen. |
|
Number |
10 |
Maximum records to show in Top N charts in Statistics screen. |
|
Number |
5 |
Maximum number of records to show in Top N charts for comparison in Statistics screen. |
|
ON/OFF Toggle |
ON |
If enabled, Other category will be shown for Top N Statistics. |
|
String |
Other |
Label for Other category in Top N charts. Both absolute text and variables can be used to form a Title, including: {mso_name}, {mso_name_plural}, {related_mso_name}, {related_mso_name_plural}, {mso_property_name}, and {mso_property_name_plural}. |
|
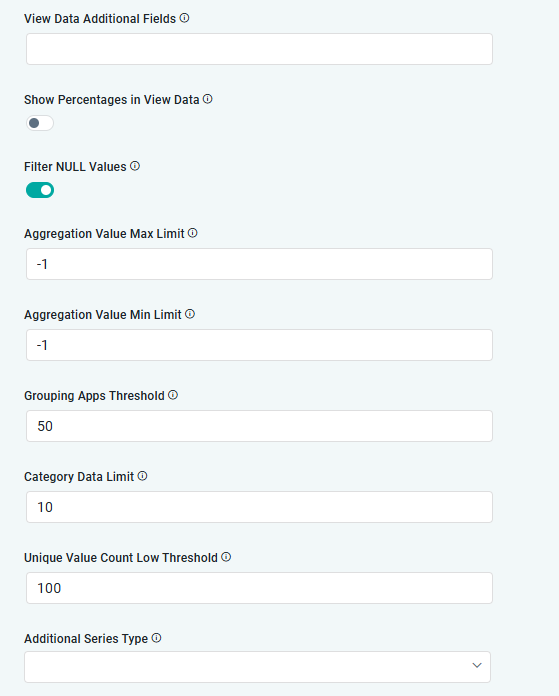
ON/OFF Toggle |
OFF |
If enabled, additional fields will be shown in the Table view in the View Data dialog (found in the Action menu). Use the format: [MSO]:[MSO Property],[MSO Property], … |
|
ON/OFF Toggle |
OFF |
If enabled, percentages in the View Data table will be shown when Count is used. |
|
ON/OFF Toggle |
ON |
If enabled, NULL values will not be shown for all Statistics based views. |
|
Number |
-1 |
Will filter aggregated data (Count, Avg, Min, Max, etc…) that is more than this setting. |
|
Number |
-1 |
Will filter aggregated data (Count, Avg, Min, Max, etc…) that is less than this setting. |
|
Number |
50 |
Threshold to group the Apps generated by Statistics. The Apps will be shown in a Carousel after the limit provided. |
|
Number |
10 |
Number of records to consider in showing category data based Apps. |
|
Number |
100 |
Maximum number of unique records to consider to generate a Chart when category fields are not specified. |
|
Dropdown |
|
Additional series type in Statistics screens, including Line, Bar, Column, and Scatter. The last series is added with own Y-axis and whatever type is selected. |
|
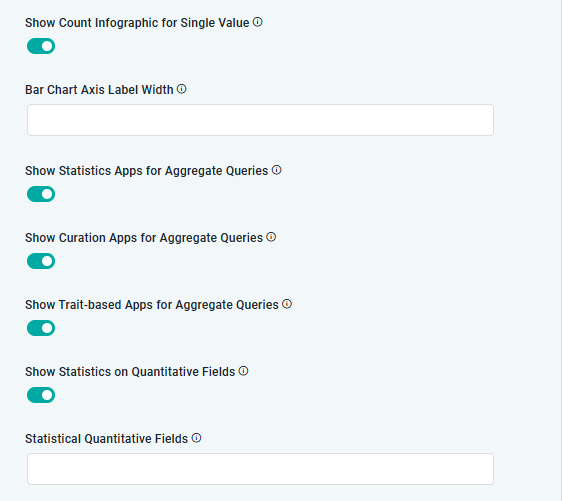
ON/OFF Toggle |
OFF |
If enabled, Infographic will be shown for curated items with a single value. |
|
Number |
|
Y-Axis Label Width for Bar Charts can be shortened based on the number provided. This is especially useful if the labels representing data/aggregations are very long. |
|
ON/OFF Toggle |
ON |
If enabled, will displayStatistics Apps for Aggregate Queries. |
|
ON/OFF Toggle |
ON |
If enabled, will display the manually configured Curation Apps for Aggregate Queries. |
|
ON/OFF Toggle |
ON |
If enabled, will display Trait-baed Apps for Aggregate Queries. |
|
ON/OFF Toggle |
OFF |
If enabled, will display Statistics Apps for TopN queries. |
|
ON/OFF Toggle |
OFF |
If enabled, will display the manually configured Curation Apps enabled to show TopN views. |
|
ON/OFF Toggle |
OFF |
If enabled, will display Trait-based Apps for TopN. |
|
ON/OFF Toggle |
OFF |
If enabled, will show Statistics on Quantitative Fields. This Quantitative Fields are configured in the next setting. |
|
String |
|
Provide list of Statistical Quantitative Fields to include if the previous setting is enabled. Use Field Name format (not Display Name). |
Contact App Orchid | Disclaimer