Intended audience: end-users developers
AO Platform: 4.3
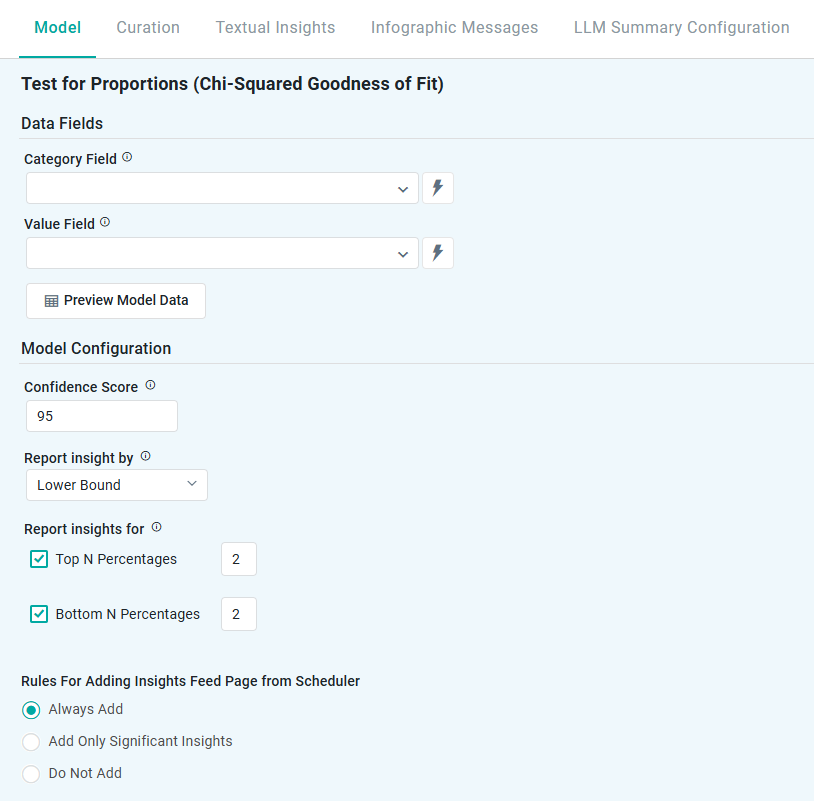
Test for Proportions
The Model tab generally includes one or more of the following sections:
-
Data Fields - these are the data field configuration properties mandatory for the model to execute.
-
Model Specific Configurations - configuration properties in this section will vary depending on the selected model. If the model does not require additional configuration, the section(s) will not be shown.
Chi-Squared Test (Goodness of Fit)
Properties
|
Label |
UI |
Default |
Description |
|---|---|---|---|
|
Data Fields |
|
|
|
|
Dropdown w/Expression |
|
Represents non-numeric groupings (eg, product type, customer segment) used to compare differences across multiple samples. |
|
Dropdown w/Expression |
|
The numerical data being analyzed (eg, sales, conversion rate) to test whether differences between groups are statistically significant. |
|
Button |
|
Opens a dialog to view the data that will be used by the model. See Model > Model tab | Preview Model Data Dialog. |
|
Model Configuration |
|
|
|
|
Number field |
95 |
Represents the range in which the true prediction is expected to fall, based on a chosen confidence level. For example, a 95% confidence level means there’s a 95% chance the actual value lies within that range. Users can adjust the confidence level (eg, 90 to 99), with higher levels widening the interval to reflect greater certainty. |
|
Dropdown |
Lower Bound |
Defines how insights are generated based on key statistical measures:
|
|
Checkboxes |
2 |
This setting allows users to focus on the Top N or Bottom N categories based on their proportions. Top N - highlights the categories with the highest proportions (eg, top-performing products or highest conversion rates). Bottom N - identifies the categories with the lowest proportions (eg, underperforming regions or lowest customer engagement). |
|
Rules for Adding to Insights Feed Page from Scheduler |
Radio-buttons |
|
This section allows the user to select if the Quick Insight will be added to the Insights Feed page when generated from a Scheduled Task. See Model > Model tab | Rules for Adding Insights Feed Page from Scheduler. |
Contact App Orchid | Disclaimer