Intended audience: end-users developers
AO Platform: 4.3
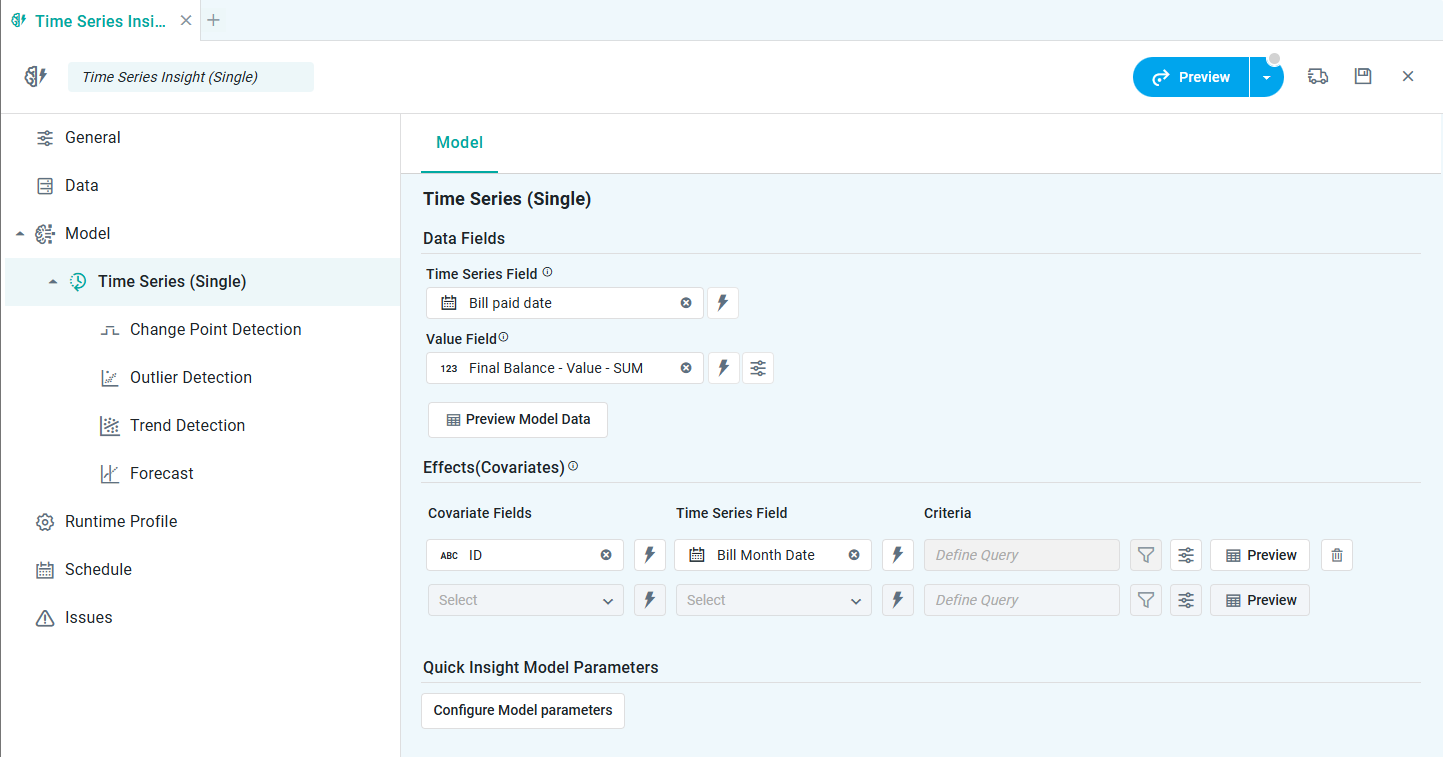
Time-Series - Single
The Model tab generally includes one or more of the following sections:
-
Data Fields - these are the data field configuration properties mandatory for the model to execute.
-
Model Specific Configurations - configuration properties in this section will vary depending on the selected model. If the model does not require additional configuration, the section(s) will not be shown.
Data Fields
Properties
|
Label |
UI |
Default |
Description |
|---|---|---|---|
|
Data Fields |
|
|
|
|
Dropdown w/Expression |
|
Select a Date Field for the time series model. |
|
Dropdown w/Expression |
|
Select a Value Field for the time series model. |
|
Icon |
|
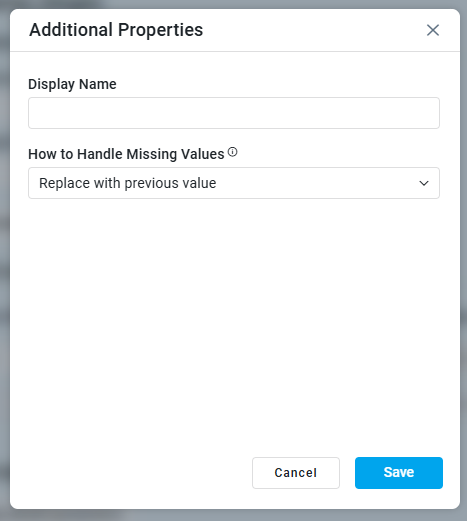
Allows a Display Name to be assigned to the Value Field selected and to select How to Handle Missing Values.
|
|
Button |
|
Opens a dialog to view the data that will be used by the model. See Model > Model tab | Preview Model Data Dialog. |
|
Effects (Covariates) |
|
|
This is a repeater section that allows one or more Covariate Fields to be selected, which will influence the model with respect to the main Data Fields selected above. For example, if the model sets out to predict a Temperature Forecast, by adding external influencing factors (such as Humidity, Wind Speed, Mean Pressure), the analysis will quantify the degree to which each external variable contributes to the variability in the Mean Temperature. |
|
Dropdown w/Expression |
|
Select a Covariate Field. |
|
Dropdown w/Expression |
|
Select a Time Series Field. |
|
Read-only Text Field w/Filter Icon |
|
Opens the Query Builder to allow one or more filter criteria to be added for the data. |
|
Icon |
|
See above. |
|
Button |
|
Opens a dialog to view the Covariate Data as relating to the Model Data. |
|
Icon |
|
Deletes the Covariate configuration entry. |
|
Quick Insight Model Parameters |
|
|
|
|
Button |
|
Opens a dialog to select child models for the current parent model. See Model > Model tab | Quick Insights Model Parameters. |
Configure Model Parameters
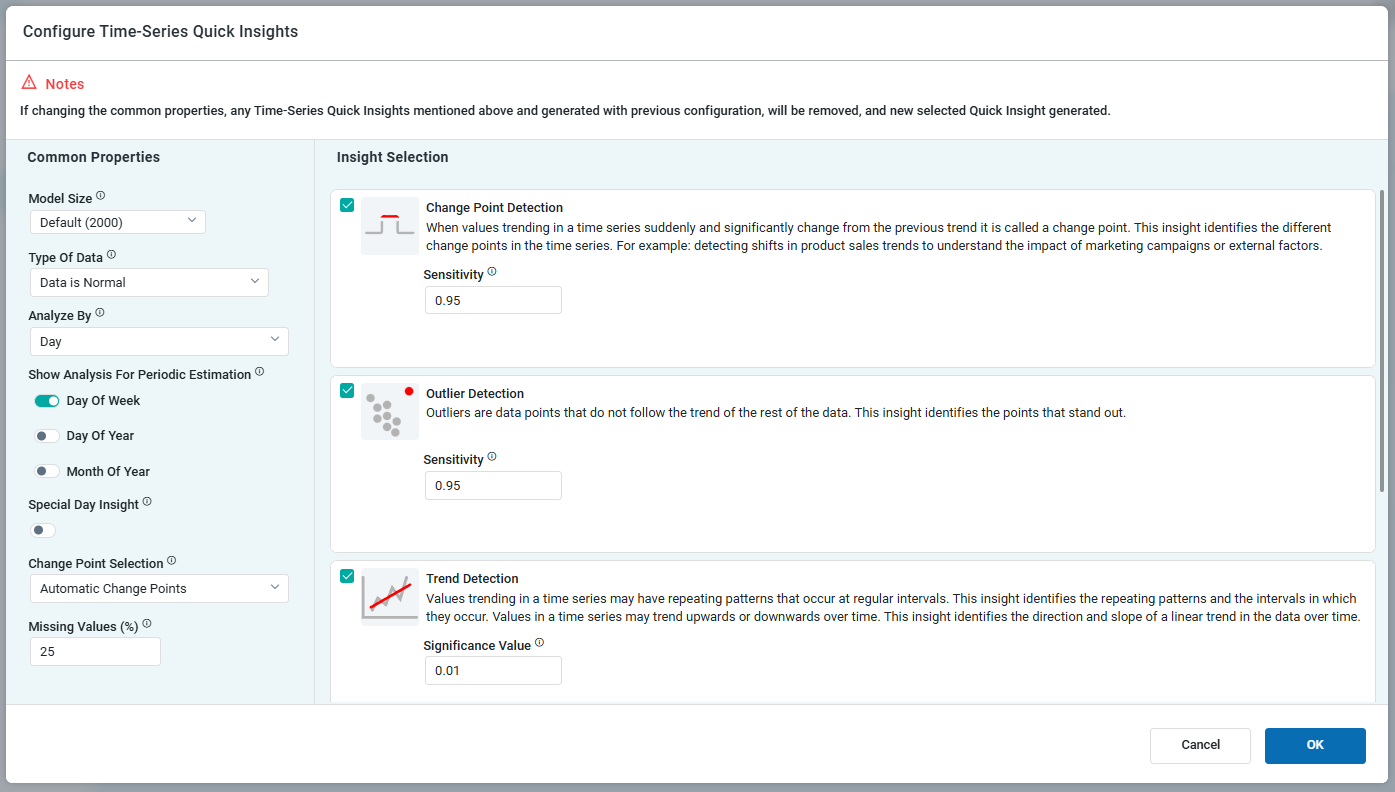
Common Properties
|
Label |
UI |
Default |
Description |
|---|---|---|---|
|
Model Size |
Dropdown |
Default (2000) |
Manage the model’s size. Larger models provide reliable interpretations at the cost of longer insight run times. Smaller models produce quicker results but lack the inclusiveness of larger counterparts.
|
|
Number of Trials |
Number Field |
2000 |
Enter a number for the number of Trial Samples. This field is only visible if the user has selected Custom in the Model Size field above. |
|
Type of Data |
Dropdown |
Data is Normal |
Select the Type of Data from either of the following options:
|
|
Analyze By |
Dropdown |
Day |
Time durations for which the data will be analyzed. Multi-select (tags) for one or more time duration values, including:
|
|
Show Analysis for Periodic Estimation |
ON/OFF Toggles |
|
One or more On/Off Toggles will show depending on the selection for Analyze By above. |
|
Special Day Insight |
ON/OFF Toggle |
ON |
Will generate additional insights relating specifically to configured Special Days for the Ontology. This toggle is only available if Day is selected for Analyze By above. |
|
Change Point Selection |
Dropdown |
Automatic Change Points |
Select how Change Points will help the model adjust to significant shifts in business trends, including:
|
|
Number of Candidate Change Points |
Number field |
5 |
Defines how many key trend shifts the system considers when analyzing business data. This field only shows when the Candidate Change Points value is selected in the Change Point Selection above.
|
|
Select a Date(s)/Range |
Date Field(s) |
|
Defines specific Date(s)/Range for Change Points. This field only shows when the Custom Change Points value is selected in the Change Point Selection above. |
|
Missing Values (%) |
Text Field |
25 |
Represents the percentage of missing data in the time series, helping assess data quality. It also defines the limit for how much missing data can be imported. A higher threshold allows the model to tolerate and fill in more missing values, which can impact forecast accuracy. |
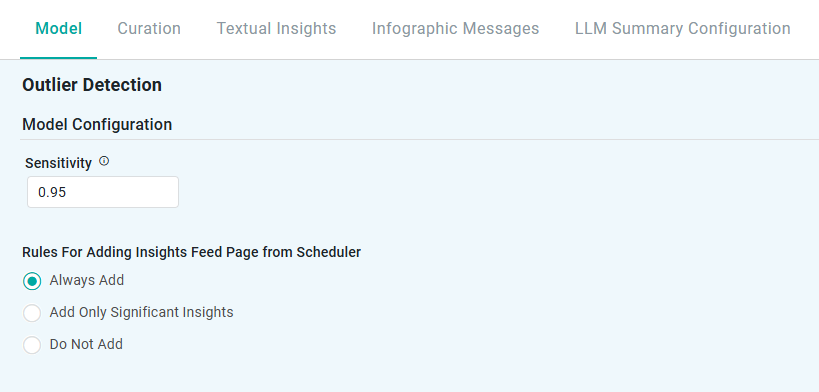
Model Configuration - Outliers
Properties
|
Label |
UI |
Default |
Description |
|---|---|---|---|
|
Model Configuration |
|
|
|
|
Number field |
0.95 |
Controls how far away from the expected distribution a point needs to be considered an outlier.
|
|
Rules for Adding to Insights Feed Page from Scheduler |
Radio-buttons |
|
This section allows the user to select if the Quick Insight will be added to the Insights Feed page when generated from a Scheduled Task. See Model > Model tab | Rules for Adding Insights Feed Page from Scheduler. |
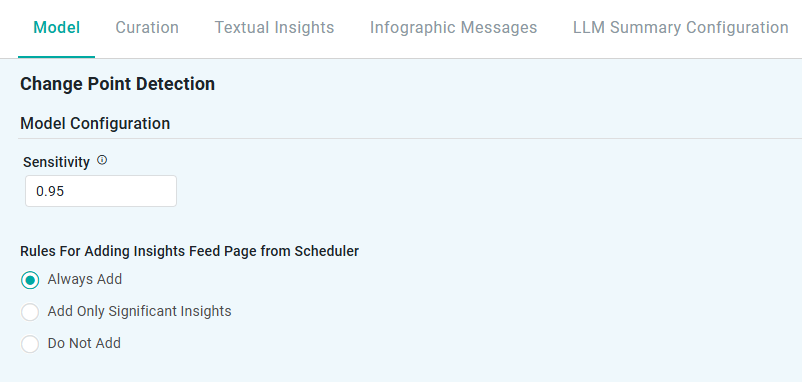
Model Configuration - Change Points
Properties
|
Label |
UI |
Default |
Description |
|---|---|---|---|
|
Model Configuration |
|
|
|
|
Number field |
0.95 |
Controls how far away from the expected distribution a point needs to be considered an outlier.
|
|
Rules for Adding to Insights Feed Page from Scheduler |
Radio-buttons |
|
This section allows the user to select if the Quick Insight will be added to the Insights Feed page when generated from a Scheduled Task. See Model > Model tab | Rules for Adding Insights Feed Page from Scheduler. |
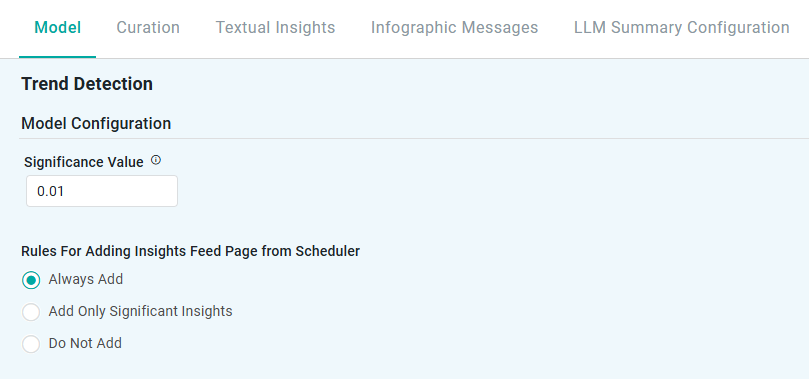
Model Configuration - Trend Line and Periodic Estimation
Properties
|
Label |
UI |
Default |
Description |
|---|---|---|---|
|
Significance |
Number field |
0.01 |
Controls how much the distribution of change point slopes can overlap to be considered individual change points
|
|
Rules for Adding to Insights Feed Page from Scheduler |
Radio-buttons |
|
This section allows the user to select if the Quick Insight will be added to the Insights Feed page when generated from a Scheduled Task. See Model > Model tab | Rules for Adding Insights Feed Page from Scheduler. |
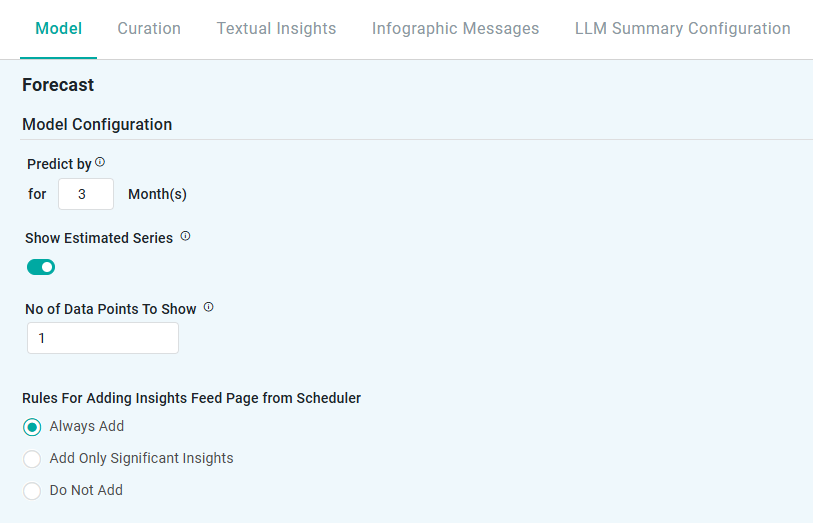
Model Configuration - Forecast
Properties
|
Label |
UI |
Default |
Description |
|---|---|---|---|
|
Predict By |
Number field |
|
Time durations for which the data will be analyzed and the desired number of predictions - enter the number of hours, days, weeks, months, or years for the predicted time period. |
|
Show Estimated Series |
On/Off toggle |
Off |
Displays the predicted values alongside actual data, allowing businesses to compare forecasts with historical trends and assess model accuracy. |
|
No of Data Points to Show |
|
1 |
Number of data points to show by default in chart. |
|
Rules for Adding to Insights Feed Page from Scheduler |
Radio-buttons |
|
This section allows the user to select if the Quick Insight will be added to the Insights Feed page when generated from a Scheduled Task. See Model > Model tab | Rules for Adding Insights Feed Page from Scheduler. |
Contact App Orchid | Disclaimer