Intended audience: end-users analysts developers administrators
AO Platform: 4.4
Overview
This section contains an overview of Infographics. Infographics refers to the process of designing and presenting data or information visually in a way that is both engaging and easy to understand. Infographics combine charts, graphs, icons, text, and other visual elements to convey complex information effectively.
Examples
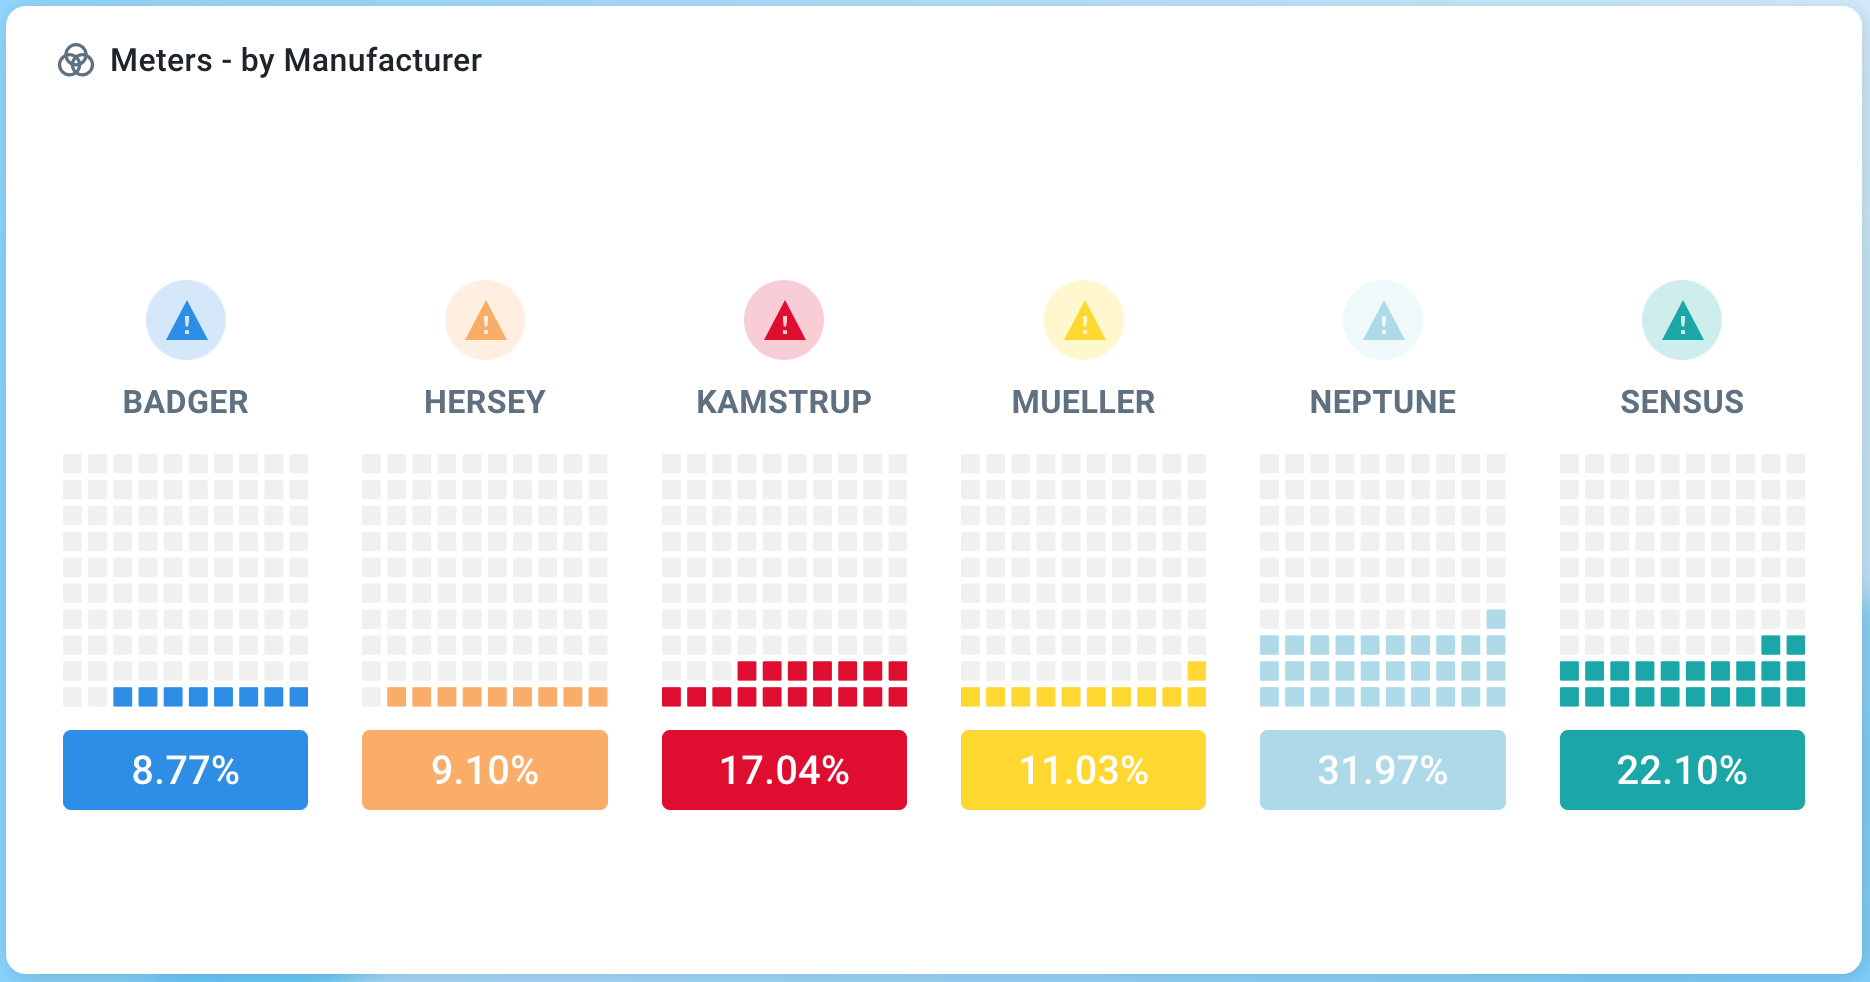
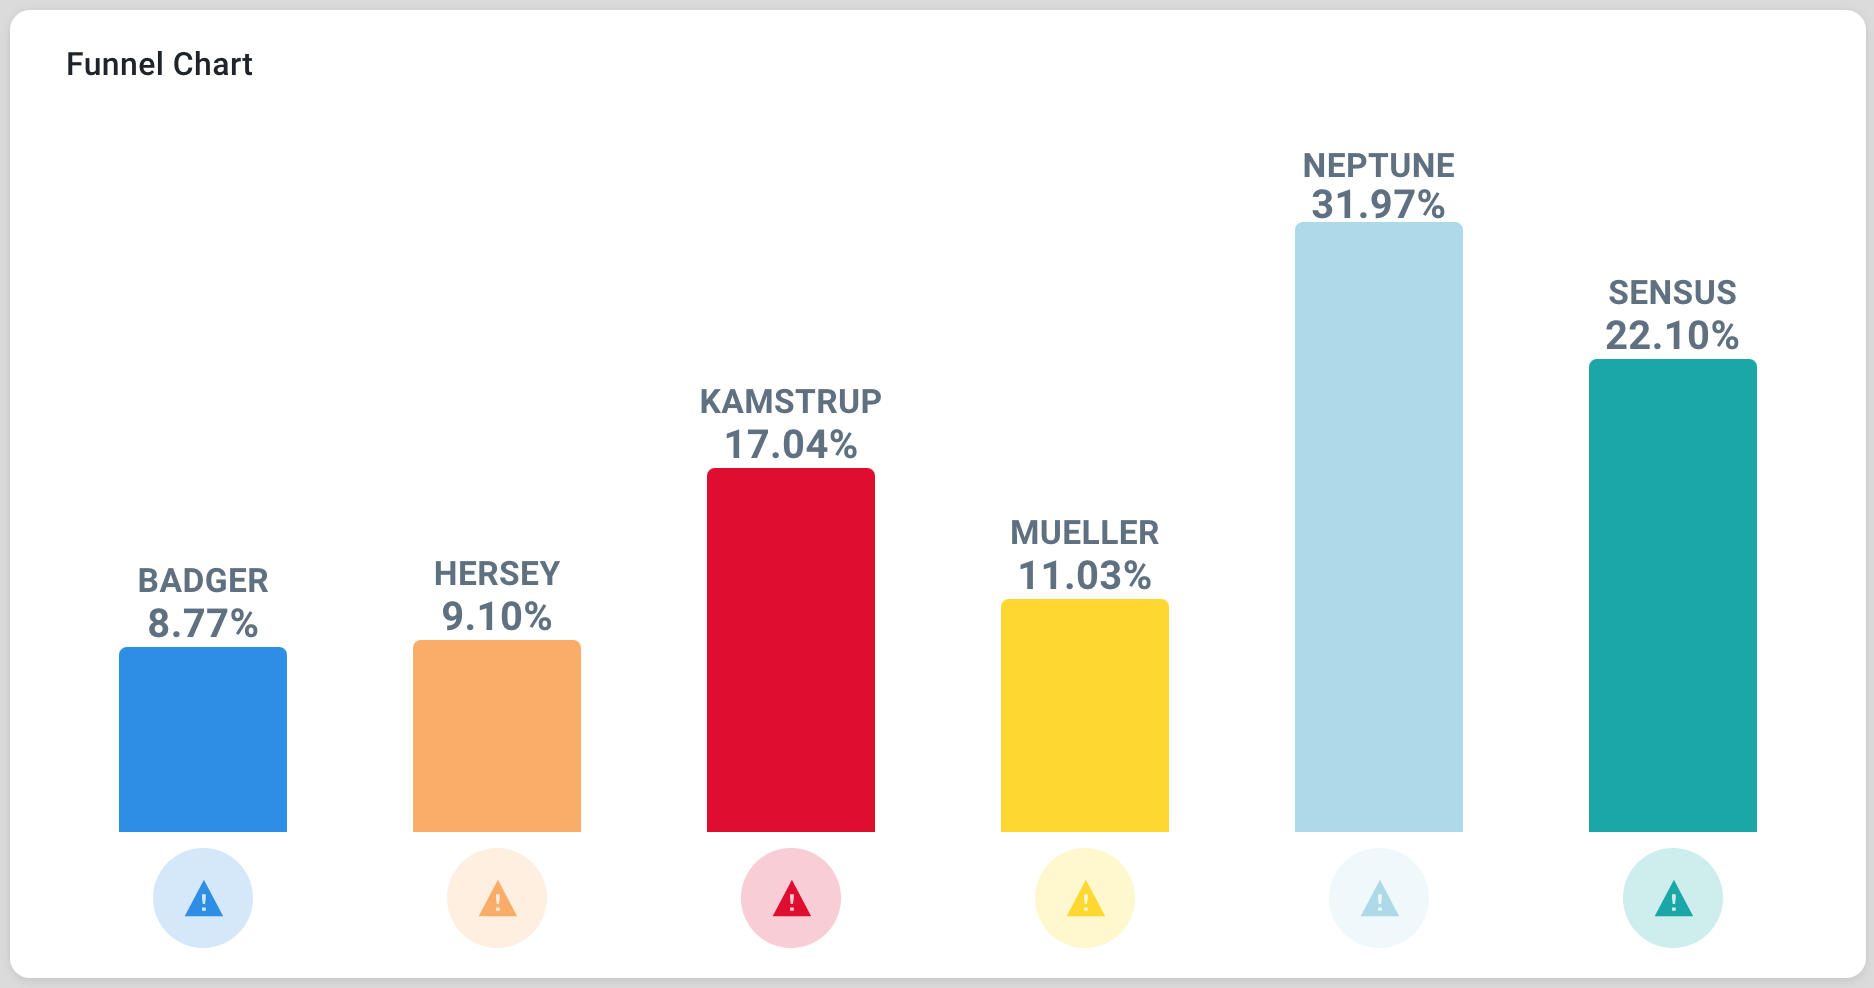
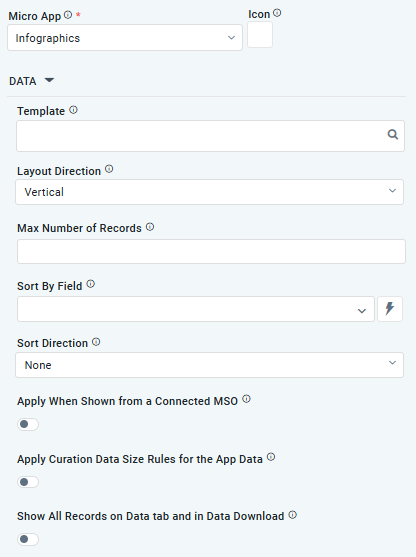
Configuration of Infographics
DATA Properties
|
Label |
UI Widget |
Default |
Description |
|---|---|---|---|
|
Template |
Search Field |
|
The Template search field allows the user to select from existing templates to be used for the Cue Card. |
|
Layout Direction |
Dropdown |
|
The Layout Direction dropdown allows the user to specify the layout orientation for the visual component in the selected template, choosing between Vertical or Horizontal. |
|
Number Field |
|
Option to set a Max number of records to be used by the Chart. |
|
Dropdown w/Expression option |
|
The Sort By Field option allows the user to select a field to sort the data and also provides the flexibility to define a custom expression for more advanced sorting criteria. |
|
Dropdown |
|
Option to set the Sort order for data in the Chart to either Ascending or Descending. |
|
ON/OFF Toggle |
OFF |
The Apply When Shown from a Connected MSO ON/OFF Toggle determines whether the settings or actions are applied specifically when data is displayed through a connected MSO.
|
|
ON/OFF Toggle |
OFF |
If enabled, the Record Count rules will be applied. If the Record Count rules are not met, the series will not be shown. |
|
ON/OFF Toggle |
OFF |
If enabled, all records, otherwise excluded by the LIMIT clause when “Show TopN Plus Other” is enabled, and used by the App, will be shown on the App’s Data tab as well as in the Download Data option. |
Contact App Orchid | Disclaimer