Intended audience: analysts developers administrators
AO Platform: 4.3
Overview
-
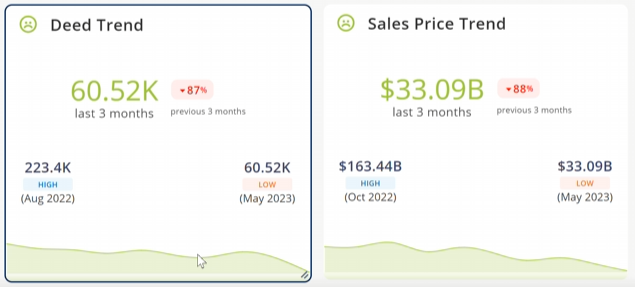
This trait is used to show KPI Trend cards in Easy Answers with the following components:
-
KPI value (aggregation for the default period) and Rate of Change for the previous period.
-
Trend chart at the bottom for the default interval.
-
High and Low values from the trend chart.
-
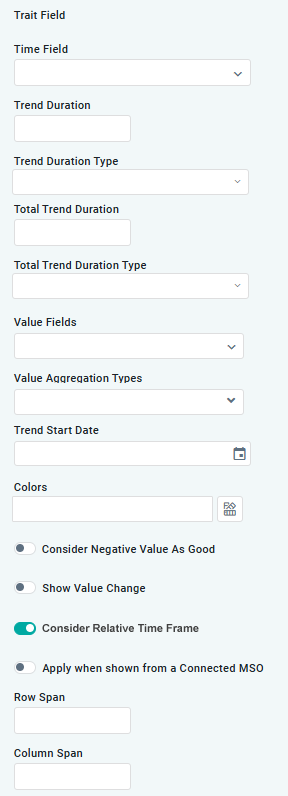
Trait Fields
|
Label |
UI Widget |
Description |
|---|---|---|
|
Time Field |
Dropdown |
Select MSO field property with a date/time value. |
|
Trend Duration |
Number |
|
|
Trend Duration Type |
Dropdown |
Select Duration Type from list of available options: Day, Month, Month and Year, Quarter, Week, Year. |
|
Total Trend Duration |
Number |
|
|
Total Trend Duration Type |
Dropdown |
Select Duration Type from list of available options: Day, Month, Month and Year, Quarter, Week, Year. |
|
Value Fields |
Dropdown |
Repeater section for MSO field properties that are to be used for the Trend lines. |
|
Value Aggregation Types |
Dropdown |
Repeater section for Value Aggregation Types. Select from list of available options: Avg, Count, Countdistinct, Expression, Max, Min, Stddev, Stedevpop, Sum, Variance. |
|
Trend Start Date |
Calendar |
|
|
Colors |
Color palette |
Select Color palette per Theme. |
|
Consider Negative Value as Good |
ON/OFF Toggle |
OFF is default. |
|
Show Value Change |
ON/OFF Toggle |
OFF is default. |
|
Consider Relative Time Frame |
ON/OFF Toggle |
If enabled, the Chart data showing for the Trend will be relative to current date. ON is default. |
|
Apply when shown from a Connected MSO |
ON/OFF Toggle |
OFF is default. |
|
Row Span |
|
The Number of Rows the Trend App will use in the Result page Layout. |
|
Column Span |
|
The Number of Columns the Trend App will use in the Result page Layout. |
Example Visualization
Contact App Orchid | Disclaimer