Intended audience: end-users analysts developers administrators
AO Platform: 4.3
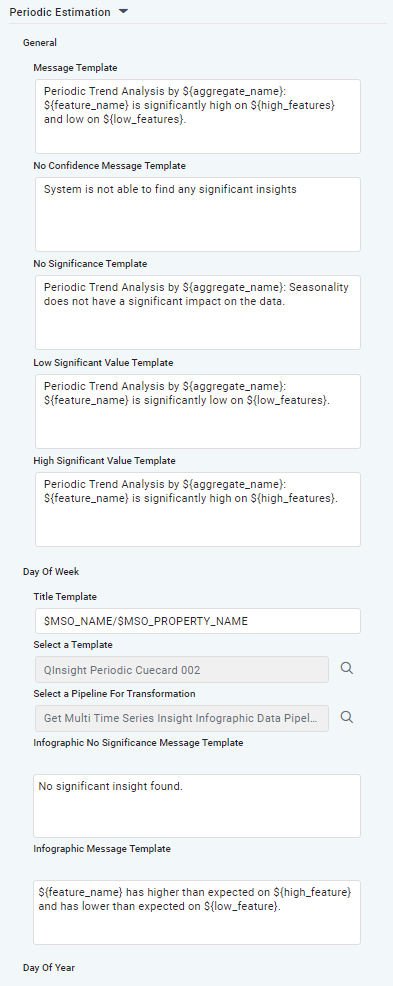
Properties for Insights > Periodic Estimation
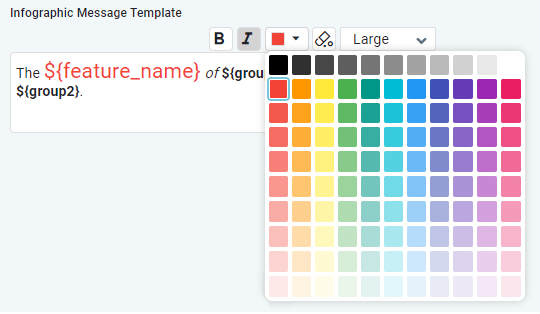
Formatting of Infographic Message Template
Some multi-line text field properties have additional formatting options. These properties are related to the Infographic card templates. Options include:
-
B - select some text, then click B to turn selected text Bold
-
I - select some text, then click I to turn selected text Italics
-
Color - select some text, then click dropdown to select a color
-
Clear - click to clear all existing formatting of the text
-
Font - select some text, then click dropdown to select font-size (small, medium, large)
|
Label |
Type |
Default Value |
Description |
|---|---|---|---|
|
Day of Week |
|
|
|
|
Text Field |
$INSIGHT_TYPE - $MSO_NAME/$MSO_PROPERTY_NAME for $RUNTIME_LABEL |
Available variables
|
|
Search Dialog |
QInsight Periodic Cuecard 002 |
Use Search dialog to select a Quick Insight Template. |
|
Search Dialog |
Get Multi Time Series Insight Infographic Data Pipeline |
Use Search dialog to select a Pipeline that will transform input data into a suitable format for the Quick Insight model (optional). |
|
Multiline Text Field with formatting options |
No significant insight found. |
Template for the Infographic card - no significance. |
|
Multiline Text Field with formatting options |
${feature_name} has higher than expected on ${high_feature} and has lower than expected on ${low_feature}. |
Template for the Infographic card. |
|
Day of Year |
|
|
|
|
Text Field |
$INSIGHT_TYPE - $MSO_NAME/$MSO_PROPERTY_NAME for $RUNTIME_LABEL |
Available variables
|
|
Search Dialog |
QInsight Periodic Cuecard 002 |
Use Search dialog to select a Quick Insight Template. |
|
Search Dialog |
Get Multi Time Series Insight Infographic Data Pipeline |
Use Search dialog to select a Pipeline that will transform input data into a suitable format for the Quick Insight model (optional). |
|
Multiline Text Field with formatting options |
No significant insight found. |
Template for the Infographic card - no significance. |
|
Multiline Text Field with formatting options |
${feature_name} has higher than expected on ${high_feature} and has lower than expected on ${low_feature}. |
Template for the Infographic card. |
|
Week of Year |
|
|
|
|
Text Field |
$INSIGHT_TYPE - $MSO_NAME/$MSO_PROPERTY_NAME for $RUNTIME_LABEL |
Available variables
|
|
Search Dialog |
QInsight Periodic Cuecard 004 |
Use Search dialog to select a Quick Insight Template. |
|
Search Dialog |
Get Multi Time Series Insight Infographic Data Pipeline |
Use Search dialog to select a Pipeline that will transform input data into a suitable format for the Quick Insight model (optional). |
|
Multiline Text Field with formatting options |
No significant insight found. |
Template for the Infographic card - no significance. |
|
Multiline Text Field with formatting options |
${feature_name} has higher than expected on ${high_feature} and has lower than expected on ${low_feature}. |
Template for the Infographic card. |
|
Month of Year |
|
|
|
|
Text Field |
$INSIGHT_TYPE - $MSO_NAME/$MSO_PROPERTY_NAME for $RUNTIME_LABEL |
Available variables
|
|
Search Dialog |
QInsight Periodic Cuecard 006 |
Use Search dialog to select a Quick Insight Template. |
|
Search Dialog |
Get Multi Time Series Insight Infographic Data Pipeline |
Use Search dialog to select a Pipeline that will transform input data into a suitable format for the Quick Insight model (optional). |
|
Multiline Text Field with formatting options |
No significant insight found. |
Template for the Infographic card - no significance. |
|
Multiline Text Field with formatting options |
${feature_name} has higher than expected on ${high_feature} and has lower than expected on ${low_feature}. |
Template for the Infographic card. |
|
Quarter of Year |
|
|
|
|
Text Field |
$INSIGHT_TYPE - $MSO_NAME/$MSO_PROPERTY_NAME for $RUNTIME_LABEL |
Available variables
|
|
Search Dialog |
QInsight Periodic Cuecard 007 |
Use Search dialog to select a Quick Insight Template. |
|
Search Dialog |
Get Multi Time Series Insight Infographic Data Pipeline |
Use Search dialog to select a Pipeline that will transform input data into a suitable format for the Quick Insight model (optional). |
|
Multiline Text Field with formatting options |
No significant insight found. |
Template for the Infographic card - no significance. |
|
Multiline Text Field with formatting options |
${feature_name} has higher than expected on ${high_feature} and has lower than expected on ${low_feature}. |
Template for the Infographic card. |
|
Message Template |
Multiline Text Field |
Periodic Trend Analysis by ${aggregate_name}: ${feature_name} is significantly high on ${high_features} and low on ${low_features}. |
Template for Textual Insight, including the data variables that will be added into template at runtime. Variables available
|
|
No Significance Template |
Multiline Text Field |
Periodic Trend Analysis by ${aggregate_name}: Seasonality does not have a significant impact on the data. |
Template for Textual Insight, including the data variables that will be added into template at runtime. Variables available
|
|
Low Significant Value Template |
Multiline Text Field |
Periodic Trend Analysis by ${aggregate_name}: ${feature_name} is significantly low on ${low_features}. |
Template for Textual Insight, including the data variables that will be added into template at runtime. Variables available
|
|
High Significant Value Template |
Multiline Text Field |
Periodic Trend Analysis by ${aggregate_name}: ${feature_name} is significantly high on ${high_features}. |
Template for Textual Insight, including the data variables that will be added into template at runtime. Variables available
|
Contact App Orchid | Disclaimer