Intended audience: end-users developers
AO Platform: 4.3
Test for Rates
The Model tab generally includes one or more of the following sections:
-
Data Fields - these are the data field configuration properties mandatory for the model to execute.
-
Model Specific Configurations - configuration properties in this section will vary depending on the selected model. If the model does not require additional configuration, the section(s) will not be shown.
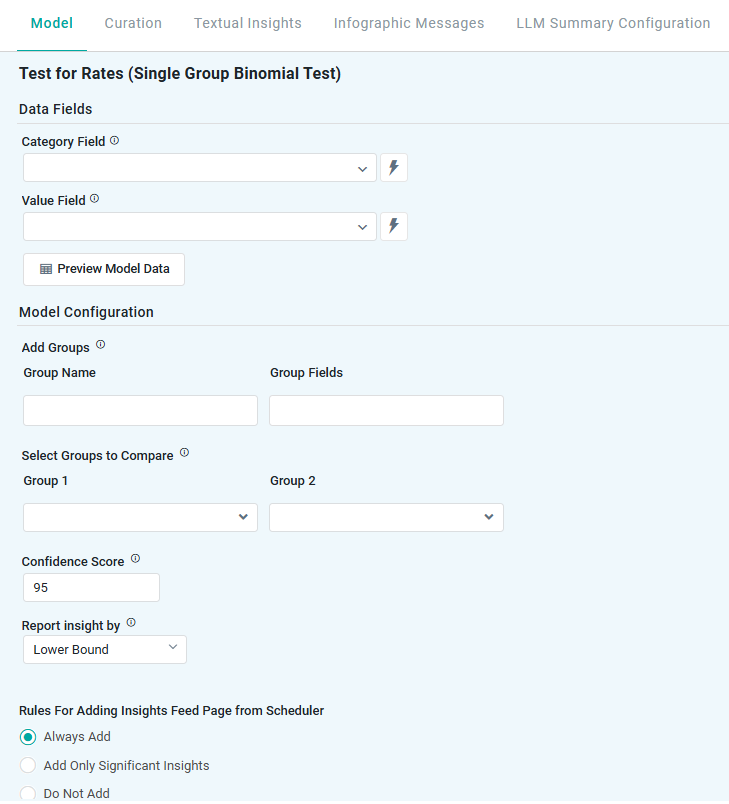
Single Group Binomial Test
Properties
|
Label |
UI |
Default |
Description |
|---|---|---|---|
|
Data Fields |
|
|
|
|
Dropdown w/Expression |
|
Represents non-numeric groupings (eg, product type, customer segment) used to compare differences across multiple samples. |
|
Dropdown w/Expression |
|
Represents the numerical data being tested, typically success or failure rates (eg, click-through rates, defect rates). |
|
Button |
|
Opens a dialog to view the data that will be used by the model. See Model > Model tab | Preview Model Data Dialog. |
|
Model Configuration |
|
|
|
|
Add Groups |
Repeater Section |
|
Allows users to define specific data segments (eg, different marketing campaigns, product variations) for separate analysis. |
|
Text Field |
|
|
|
Tags |
|
|
|
Select Groups to Compare |
Repeater Section |
|
Enables users to choose which predefined groups should be statistically compared to determine if their success rates significantly differ. |
|
Dropdown |
|
|
|
Dropdown |
|
|
|
Confidence Score |
Number Field |
95 |
Represents the range in which the true prediction is expected to fall, based on a chosen confidence level. For example, a 95% confidence level means there’s a 95% chance the actual value lies within that range. Users can adjust the confidence level (eg, 90 to 99), with higher levels widening the interval to reflect greater certainty. |
|
Report Insight By |
Dropdown |
Lower Bound |
Defines how insights are generated based on key statistical measures:
These metrics help businesses assess performance variations and make data-driven decisions. |
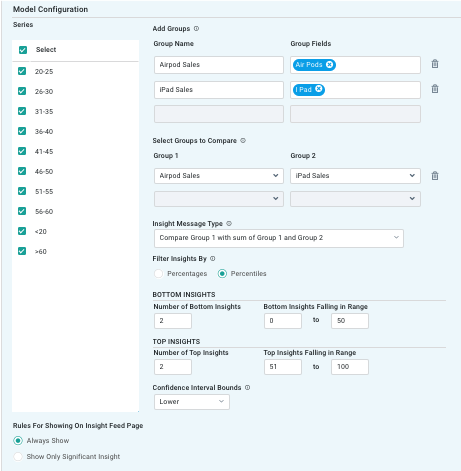
Multi Group Binomial Test
Properties
|
Label |
UI |
Default |
Description |
|---|---|---|---|
|
Data Fields |
|
|
|
|
Dropdown w/Expression |
|
Represents non-numeric groupings (eg, product type, customer segment) used to compare differences across multiple samples. |
|
Dropdown w/Expression |
|
The numerical data being analyzed (eg, sales, conversation rate) to test whether differences between groups are statistically significant. |
|
Button |
|
Opens a dialog to view the data that will be used by the model. See Model > Model tab | Preview Model Data Dialog. |
|
Model Configuration |
|
|
|
|
Checkboxes |
All selected |
|
|
Add Groups |
Repeater Section |
|
Allows users to define specific data segments (eg, regions, product lines) for separate analysis of success rates. |
|
Text Field |
|
|
|
Tags |
|
|
|
Select Groups to Compare |
Repeater Section |
|
Enables users to choose which predefined groups should be compared to determine if their success rates significantly differ. |
|
Dropdown |
|
|
|
Dropdown |
|
|
|
Insight Message Type |
Dropdown |
|
Defines how results are communicated (eg, summary insights, detailed statistical explanations) to help users interpret the findings. |
|
Filter Insights By |
Radio-buttons |
|
Allows users to refine the analysis based on specific criteria (eg, selecting only high-performing regions or filtering by threshold success rate). Options are:
|
|
Bottom Insights |
|
|
Bottom Insights - identifies categories with the lowest success rates (eg, underperforming stores or lowest response rates). |
|
Number Field |
2 |
|
|
Number Fields |
0-50 |
|
|
Top Insights |
|
|
Top Insights - highlights categories with the highest success rates (eg, top-performing products or highest engagement augments). |
|
Number Field |
2 |
|
|
Number Fields |
51-100 |
|
|
Confidence Interval Bounds |
Dropdown |
Lower |
Provides a range within which the true success rate is expected to fall, offering statistical certainty about the observed results.
|
|
Rules for Adding to Insights Feed Page from Scheduler |
Radio-buttons |
|
This section allows the user to select if the Quick Insight will be added to the Insights Feed page when generated from a Scheduled Task. See Model > Model tab | Rules for Adding Insights Feed Page from Scheduler. |
Contact App Orchid | Disclaimer