Intended audience: end-users developers
AO Platform: 4.3
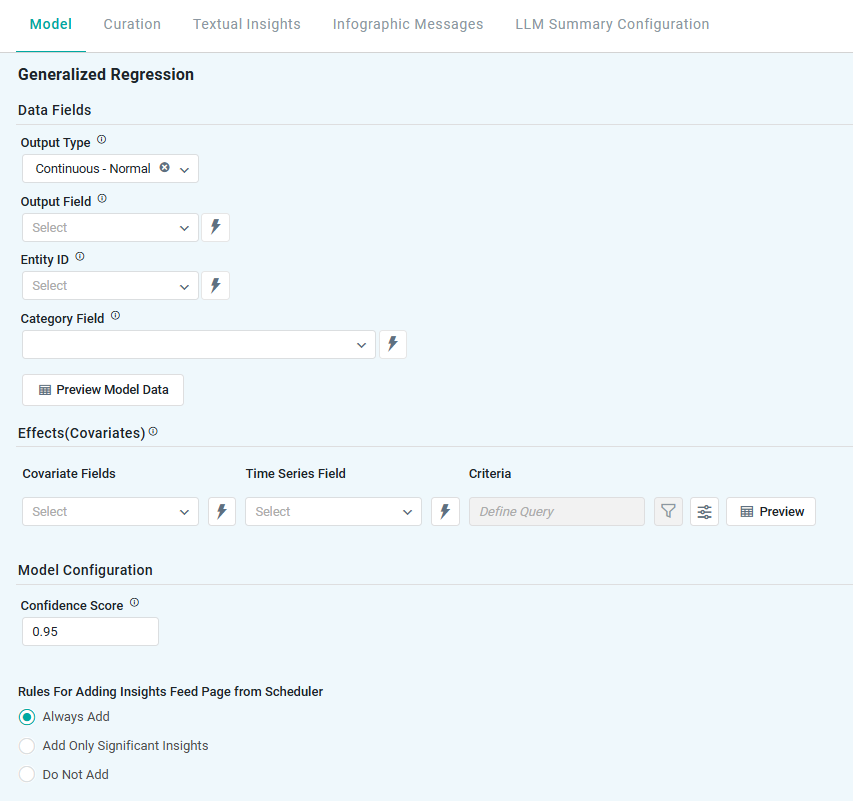
Generalized Regression
The Model tab generally includes one or more of the following sections:
-
Data Fields - these are the data field configuration properties mandatory for the model to execute.
-
Model Specific Configurations - configuration properties in this section will vary depending on the selected model. If the model does not require additional configuration, the section(s) will not be shown.
Configuration
Properties
|
Label |
UI |
Default |
Description |
|---|---|---|---|
|
Data Fields |
|
|
|
|
Dropdown |
Continuous - Normal |
Specifies the statistical distribution of the output based on the nature of the data. Available options include:
Each type is designed to align with the expected range and behavior of the output variable for accurate modeling. |
|
Dropdown w/Expression |
|
The Output Field is the target variable the model aims to predict or estimate. Its values are determined by the selected Output Type and distribution, guiding how the model interprets and forecasts outcomes based on the input data. This property is shown when the Output Type property is one of the following: Continuous, Count, or Binary. |
|
Dropdown w/Expression |
|
The Numerator shall always be less than the Denominator. This property is shown when the Output Type property is: Proportion. |
|
Dropdown w/Expression |
|
The Denominator shall always be greater than the Numerator. This property is shown when the Output Type property is: Proportion. |
|
Dropdown w/Expression |
|
A unique identifier for each record (eg, Customer ID, Employee ID) used to distinguish individual entities within the dataset. |
|
Dropdown w/Expression |
|
Represents non-numeric groupings (eg, Product Type, Customer Segment) used to compare differences across multiple samples. |
|
Button |
|
Opens a dialog to view the data that will be used by the model. See Model > Model tab | Preview Model Data Dialog. |
|
Effects (Covariates) |
Repeater section |
|
Lists additional variables that may influence the primary outcome, used to adjust or enrich the analysis. |
|
Dropdown w/Expression |
|
Select one or more Field Properties as Covariates. |
|
Dropdown w/Expression |
|
Select one or more Time Series Field Properties as Covariates. |
|
Field w/Filter |
|
Add a Filter on the Covariate data configured using the Query Builder dialog. |
|
Icon |
|
Opens the Additional Properties dialog, allowing the user to enter a Display Name for the selected Covariate Field: 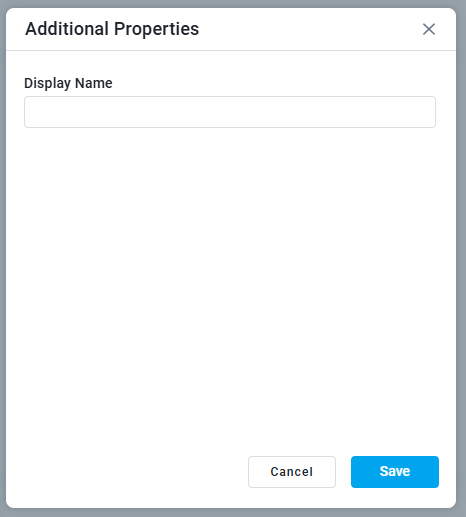
|
|
Button |
|
|
|
Model Configuration |
|
|
|
|
Number field |
0.95 |
Represents the range in which the true prediction is expected to fall, based on a chosen confidence level. For example, a 0.95 value means there’s a 95% chance the actual value lies within that range. Users can adjust the Confidence Score in the range from 0.9 to 0.99, with higher levels widening the interval to reflect greater certainty. |
|
Rules for Adding to Insights Feed Page from Scheduler |
Radio-buttons |
Always Add |
This section allows the user to select if the Quick Insight will be added to the Insights Feed page when generated from a Scheduled Task. See Model > Model tab | Rules for Adding Insights Feed Page from Scheduler. |
Contact App Orchid | Disclaimer