Intended audience: end-users developers
AO Platform: 4.3
Test for Means
The Model tab generally includes one or more of the following sections:
-
Data Fields - these are the data field configuration properties mandatory for the model to execute.
-
Model Specific Configurations - configuration properties in this section will vary depending on the selected model. If the model does not require additional configuration, the section(s) will not be shown.
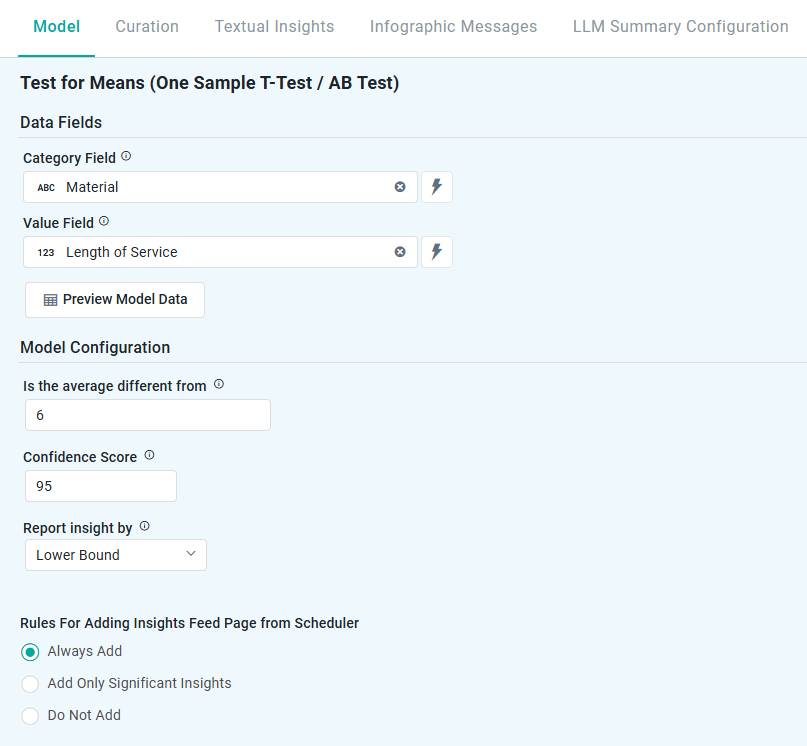
One Sample T-Test
Properties
|
Label |
UI |
Default |
Description |
|---|---|---|---|
|
Data Fields |
|
|
|
|
Dropdown w/Expression |
|
Represents non-numeric groupings (eg, product type, customer segment) used to compare differences across multiple samples. |
|
Dropdown w/Expression |
|
Contains the numerical data being tested (eg, average sales, customer ratings) to determine if the sample mean is significantly different from a given value. |
|
Button |
|
Opens a dialog to view the data that will be used by the model. See Model > Model tab | Preview Model Data Dialog. |
|
Model Configuration |
|
|
|
|
Number Field |
|
The benchmark value against which the sample mean is compared, to identify significant deviations. |
|
Number Field |
95 |
Represents the range in which the true prediction is expected to fall, based on a chosen confidence level. For example, a 95% confidence level means there’s a 95% chance the actual value lies within that range. Users can adjust the confidence level (eg, 90 to 99), with higher levels widening the interval to reflect greater certainty. |
|
Dropdown |
Lower Bound |
Defines how insights are generated based on key statistical measures:
|
|
Rules for Adding to Insights Feed Page from Scheduler |
Radio-buttons |
|
This section allows the user to select if the Quick Insight will be added to the Insights Feed page when generated from a Scheduled Task. See Model > Model tab | Rules for Adding Insights Feed Page from Scheduler. |
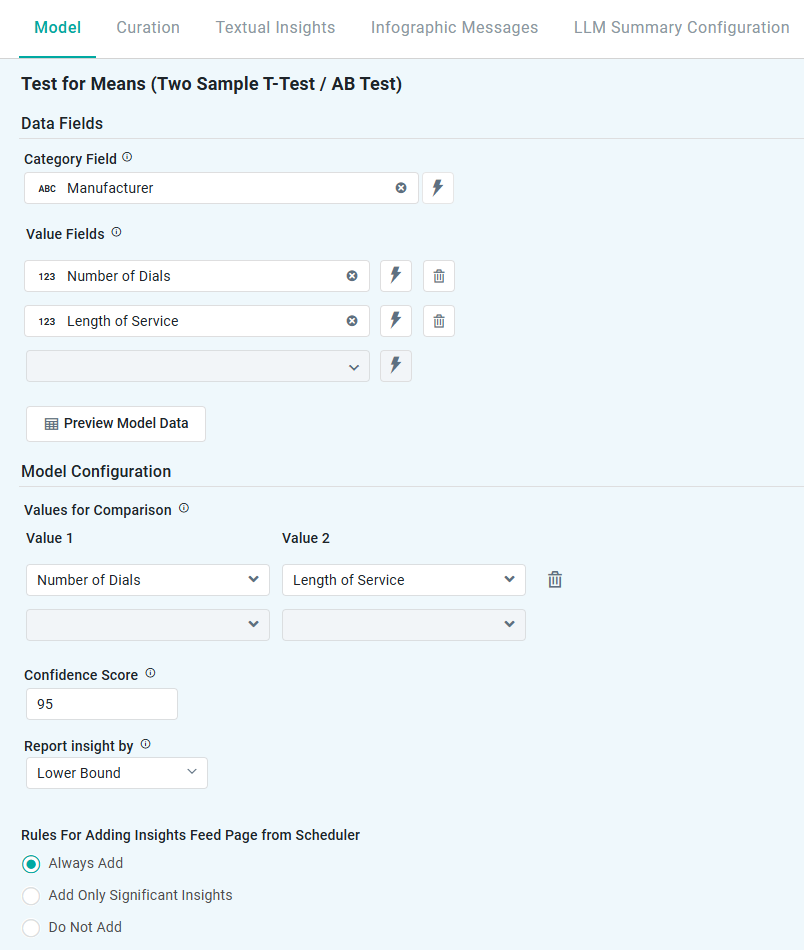
Two Sample T-Test / AB Test
Properties
|
Label |
UI |
Default |
Description |
|---|---|---|---|
|
Data Fields |
|
|
|
|
Dropdown w/Expression |
|
Represents non-numeric groupings (eg, product type, customer segment) used to compare differences across multiple samples. |
|
Dropdown w/Expression |
|
Contains the numerical data being tested (eg, revenue, customer satisfaction scores) to compare the means of two distinct groups. |
|
Button |
|
Opens a dialog to view the data that will be used by the model. See Model > Model tab | Preview Model Data Dialog. |
|
Model Configuration |
|
|
|
|
Repeater Section |
|
Defines the two data sets being analyzed to determine if there is a statistically significant difference between their mean values. |
|
Dropdown |
|
|
|
Dropdown |
|
|
|
Number Field |
95 |
Represents the range in which the true prediction is expected to fall, based on a chosen confidence level. For example, a 95% confidence level means there’s a 95% chance the actual value lies within that range. Users can adjust the confidence level (eg, 90 to 99), with higher levels widening the interval to reflect greater certainty. |
|
Dropdown |
Lower Bound |
Defines how insights are generated based on key statistical measures:
|
|
Rules for Adding to Insights Feed Page from Scheduler |
Radio-buttons |
|
This section allows the user to select if the Quick Insight will be added to the Insights Feed page when generated from a Scheduled Task. See Model > Model tab | Rules for Adding Insights Feed Page from Scheduler. |
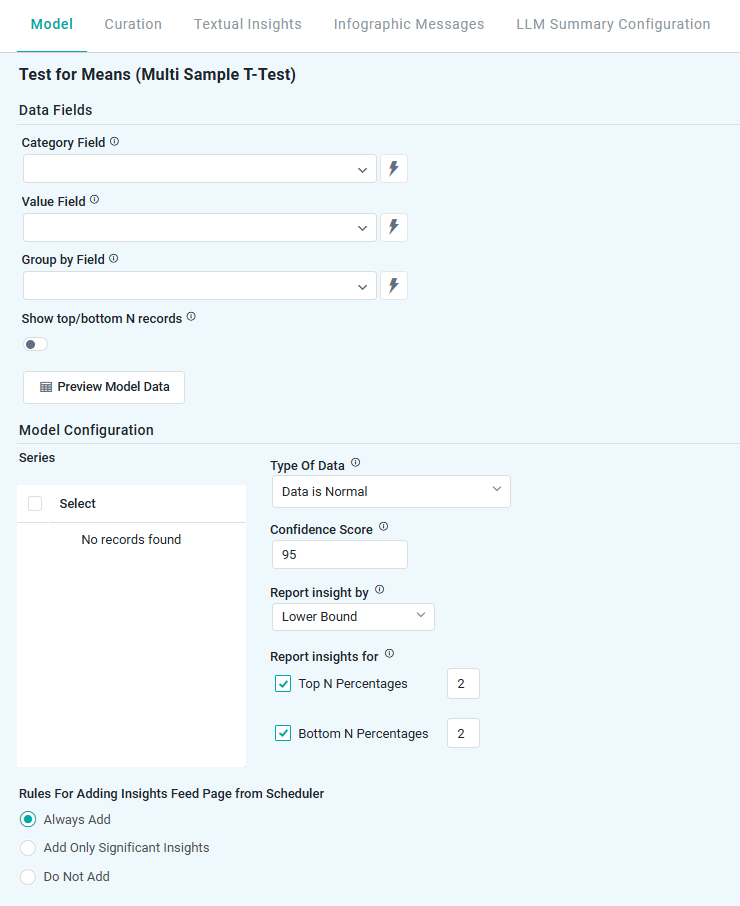
Multi Sample T-Test
Properties
|
Label |
UI |
Default |
Description |
|---|---|---|---|
|
Data Fields |
|
|
|
|
Dropdown w/Expression |
|
Represents non-numeric groupings (eg, product type, customer segment) used to compare differences across multiple samples. |
|
Dropdown w/Expression |
|
Contains the numerical data being tested (eg, average sales, customer ratings) to determine if the sample mean is significantly different from a given value. |
|
Dropdown w/Expression |
|
|
|
ON/OFF Toggle |
OFF |
Enable to show only the Top or Bottom N number of Records. |
|
Number Field |
|
Select the number of records to show if Show Top/Bottom N Records is enabled. |
|
ON/OFF Toggle |
OFF |
Enable to also show the Other category as a sum of remaining records if Show Top/Bottom N Records is enabled. |
|
Button |
|
Opens a dialog to view the data that will be used by the model. See Model > Model tab | Preview Model Data Dialog. |
|
Model Configuration |
|
|
|
|
Checkboxes |
All selected |
|
|
Dropdown |
Data is Normal |
Select the Type of Data from either of the following options:
|
|
Number Field |
95 |
Represents the range in which the true prediction is expected to fall, based on a chosen confidence level. For example, a 95% confidence level means there’s a 95% chance the actual value lies within that range. Users can adjust the confidence level (eg, 90 to 99), with higher levels widening the interval to reflect greater certainty. |
|
Dropdown |
Lower Bound |
Defines how insights are generated based on key statistical measures:
|
|
Checkboxes |
2 |
This setting allows users to focus on the Top N or Bottom N categories based on their proportions. Top N - highlights the categories with the highest proportions (eg, top-performing products or highest conversion rates). Bottom N - identifies the categories with the lowest proportions (eg, underperforming regions or lowest customer engagement). |
|
Rules for Adding to Insights Feed Page from Scheduler |
Radio-buttons |
|
This section allows the user to select if the Quick Insight will be added to the Insights Feed page when generated from a Scheduled Task. See Model > Model tab | Rules for Adding Insights Feed Page from Scheduler. |
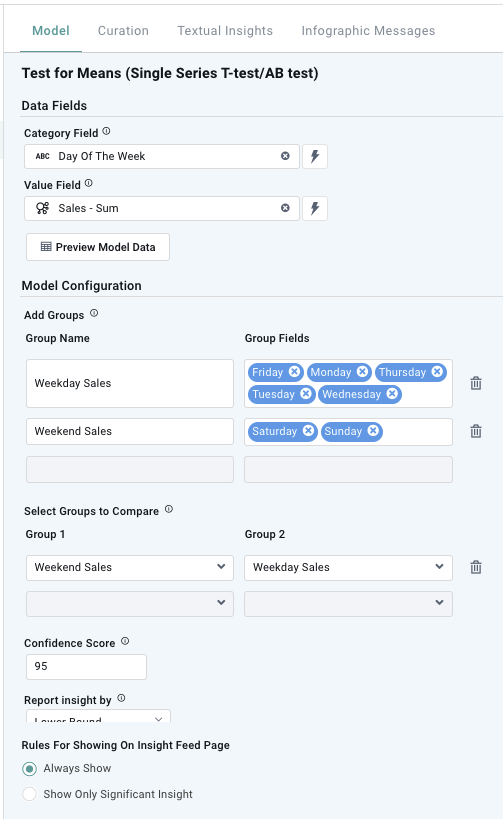
Single Series T-Test (One Sample Data to Two Groups)
Properties
|
Label |
UI |
Default |
Description |
|---|---|---|---|
|
Data Fields |
|
|
|
|
Dropdown w/Expression |
|
Represents non-numeric groupings (eg, product type, customer segment) used to compare differences across multiple samples. |
|
Dropdown w/Expression |
|
Contains the numerical data being tested (eg, average sales, customer ratings) to determine if the sample mean is significantly different from a given value. |
|
Button |
|
Opens a dialog to view the data that will be used by the model. See Model > Model tab | Preview Model Data Dialog. |
|
Model Configuration |
|
|
|
|
Add Groups |
Repeater Section |
|
Allows users to define specific data segments (eg, customer segments, product categories) for separate analysis, helping compare mean values across different groups. |
|
Text Field |
|
|
|
Tags |
|
|
|
Select Groups to Compare |
Repeater Section |
|
Enables users to choose which predefined groups should be statistically compared, determining whether their mean values are significantly different from each other. |
|
Dropdown |
|
|
|
Dropdown |
|
|
|
Number Field |
95 |
Represents the range in which the true prediction is expected to fall, based on a chosen confidence level. For example, a 95% confidence level means there’s a 95% chance the actual value lies within that range. Users can adjust the confidence level (eg, 90 to 99), with higher levels widening the interval to reflect greater certainty. |
|
Dropdown |
Lower Bound |
Defines how insights are generated based on key statistical measures:
|
|
Rules for Adding to Insights Feed Page from Scheduler |
Radio-buttons |
|
This section allows the user to select if the Quick Insight will be added to the Insights Feed page when generated from a Scheduled Task. See Model > Model tab | Rules for Adding Insights Feed Page from Scheduler. |
Contact App Orchid | Disclaimer