Intended audience: end-users developers
AO Platform: 4.5
Model tab
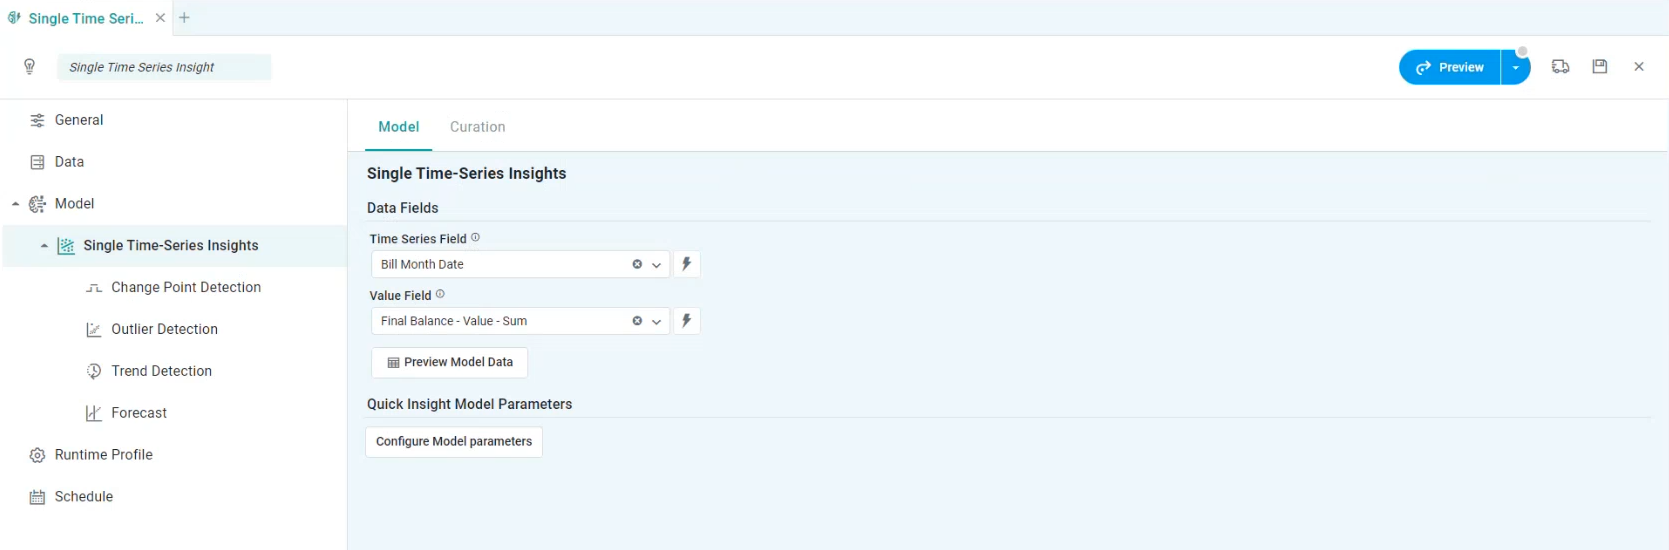
The Model tab generally includes one or more of the following sections:
-
Data Fields - these are the data field configuration properties mandatory for the model to execute.
-
Model Specific Configurations - configuration properties in this section will vary depending on the selected model. If the model does not require additional configuration, the section(s) will not be shown. Some example sections include: Effects (Covariates), Model Configuration, Time-Based MSO Covariates, …
-
Quick Insights Model Parameters - Some models are added based on first selecting a Parent Model, eg. Single Time-Series Insights. In such cases, to select the Child Model within a Parent Group, the Quick Insights Model Parameters button is used to open a dialog for the selection of one or more Child Models and their respective configurations.
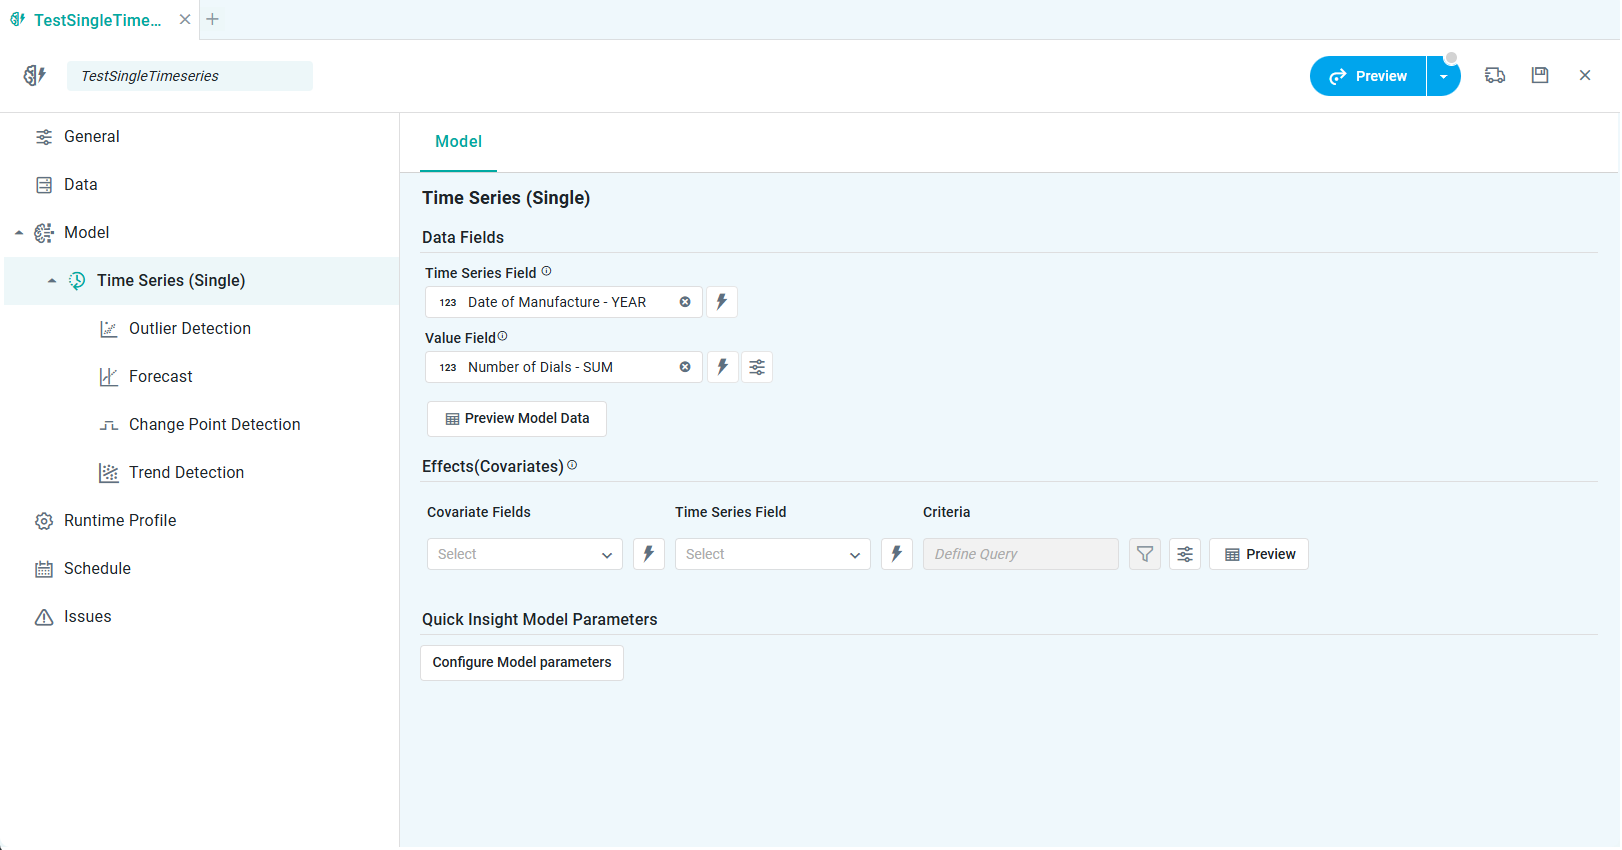
Data Fields
-
Example of Time-Series (Single) - Model tab
-
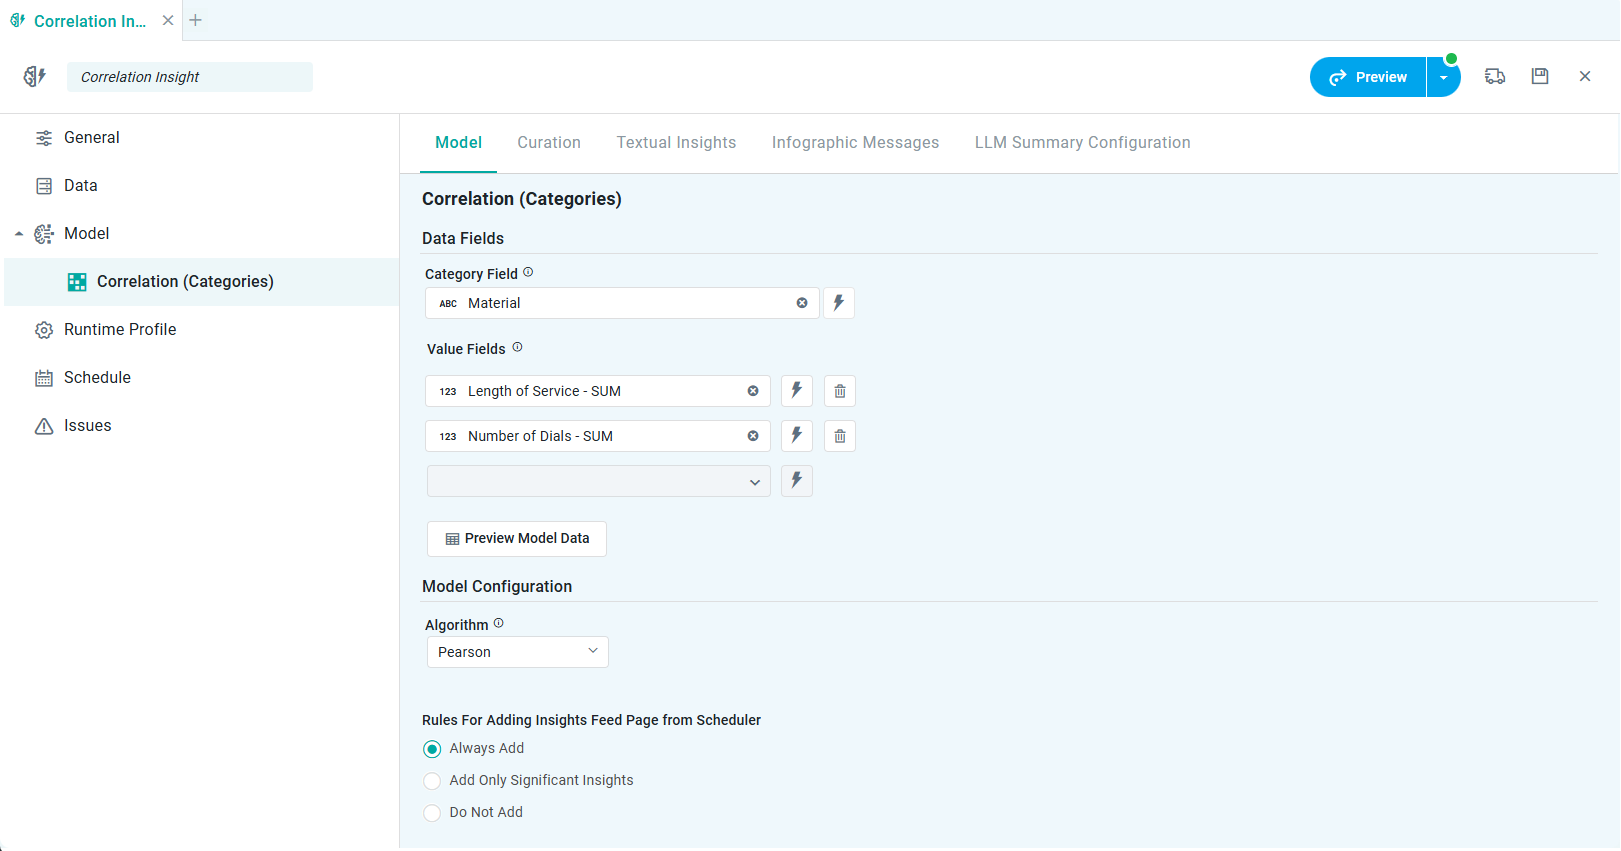
Example of Generalized Correlation - Model tab
Preview Model Data Dialog
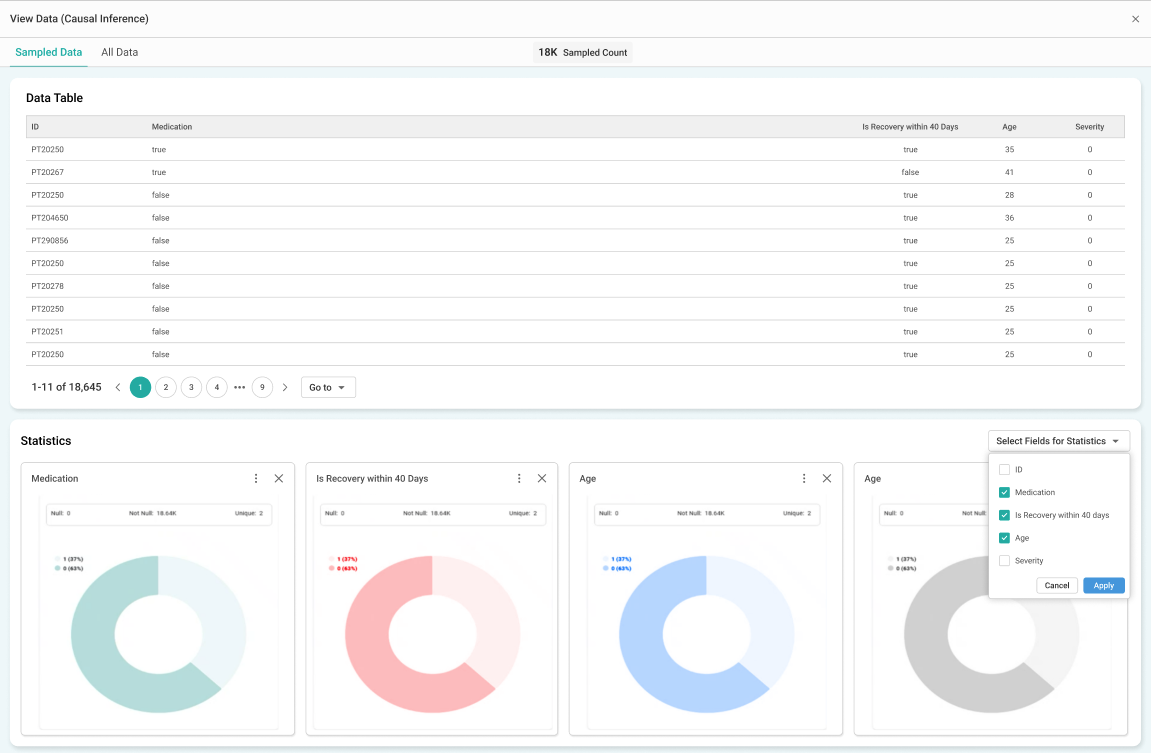
With the Data Fields section populated, clicking the Preview Model Data button will show a popup for the selected data and a Statistics section.
Data section
Some models (eg. Causal Inference) may allow the configuration of Data Sampling. If so, the Data Section of the popup will be split into…
-
Sampled Data - the Sampled Data tab represents a subset of the complete dataset, allowing for quick analysis and visualization without processing the entire data. It is useful for efficiency and faster insights.
-
All Data - The All Data tab Includes the full dataset, which may contain a significantly larger number of records. This option is useful for detailed and comprehensive analysis but may take longer to process.
Statistics section
The Statistics section provides a visual representation of key data fields. The user can customize which data fields shall be visualized using the “Select Fields for Statistics” dropdown. Such Statistics visualization works best for data fields with low cardinality and will generally be shown as a donut, histogram, or column chart.
Quick Insights Model Parameters
In the case of a Parent Model, the Configure Model Parameters button will open a dialog where both Common Properties and the Child Model parameters can be configured
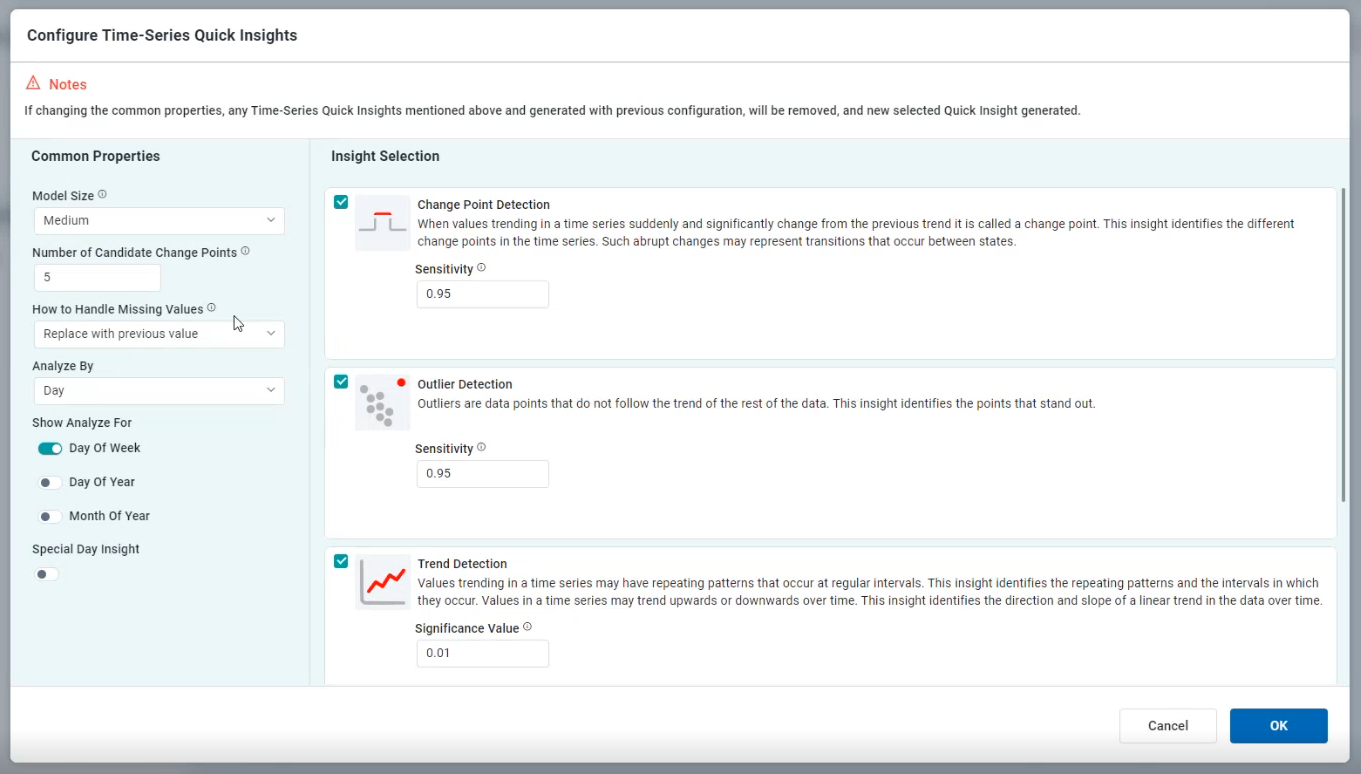
At this point, the selected Child Models will be added to the left-side panel.
Rules for Adding to Insights Feed Page from Scheduler
This section allows the user to select if the Quick Insight will be added to the Insights Feed page when generated from a Scheduled Task.
-
Always Add - Quick Insight will always be added.
-
Only Add Significant Insights - Quick Insight will only be added if the result is considered significant from a model perspective.
-
Do not Add - Quick Insight will not be added.
Previewing the Models
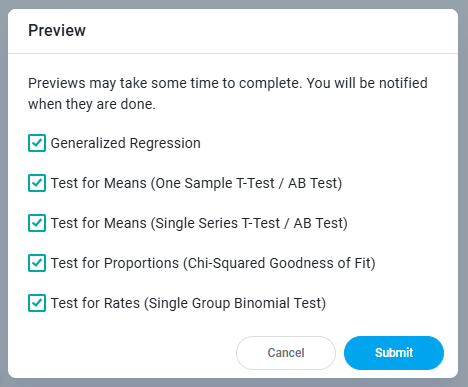
To validate that Insights can be generated from the configured Data and the selected Insight Models based on their default configuration parameters, click the Preview button in the top/right corner. Generating the Insights may take some time during which the user will receive notifications relative to the progress.
Selecting the dropdown from the Preview button shows the progress status of each of the Quick Insights being generated.
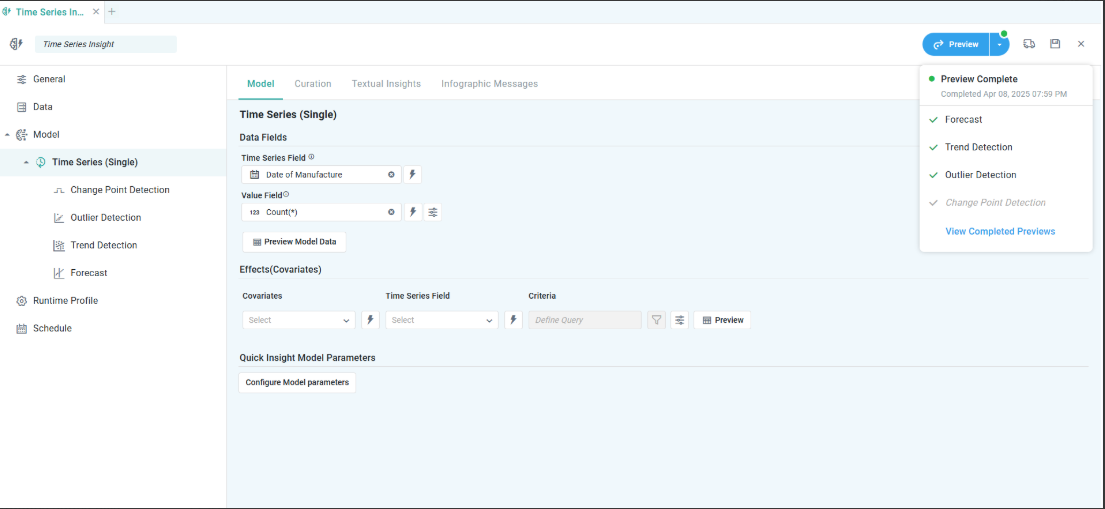
Click the View Completed Previews link in the Preview Complete dropdown in top/right corner to see the generated Quick Insights.
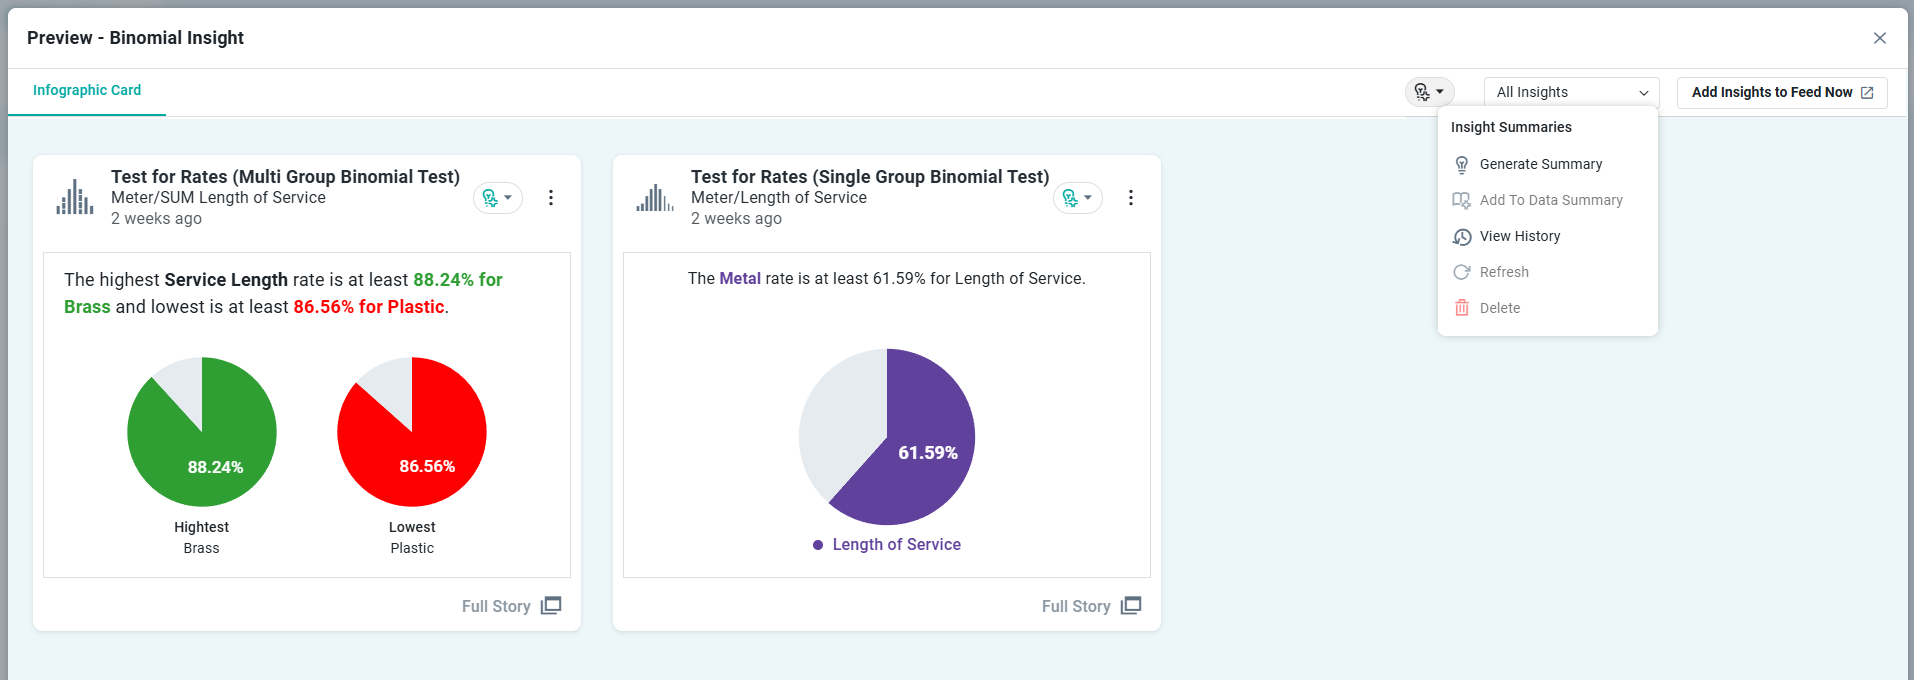
Options in the Quick Insight Preview dialog
Page Options
-
Insights Summaries
-
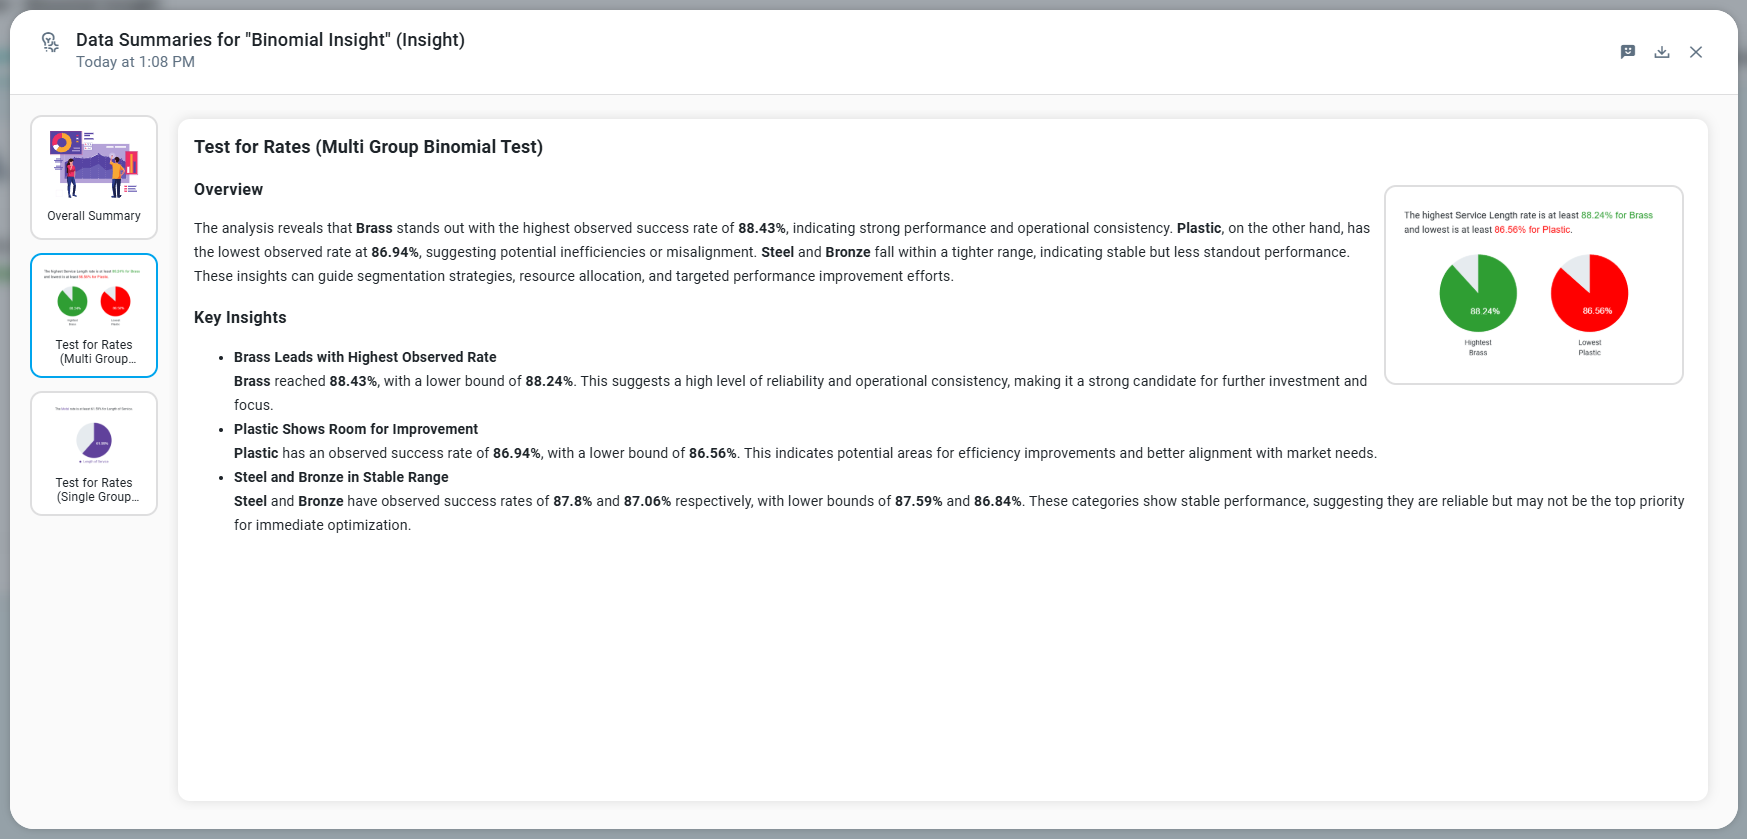
Generate Summary - opens a dialog showing a list of all applicable Insights, having Insight Summaries generated one by one.
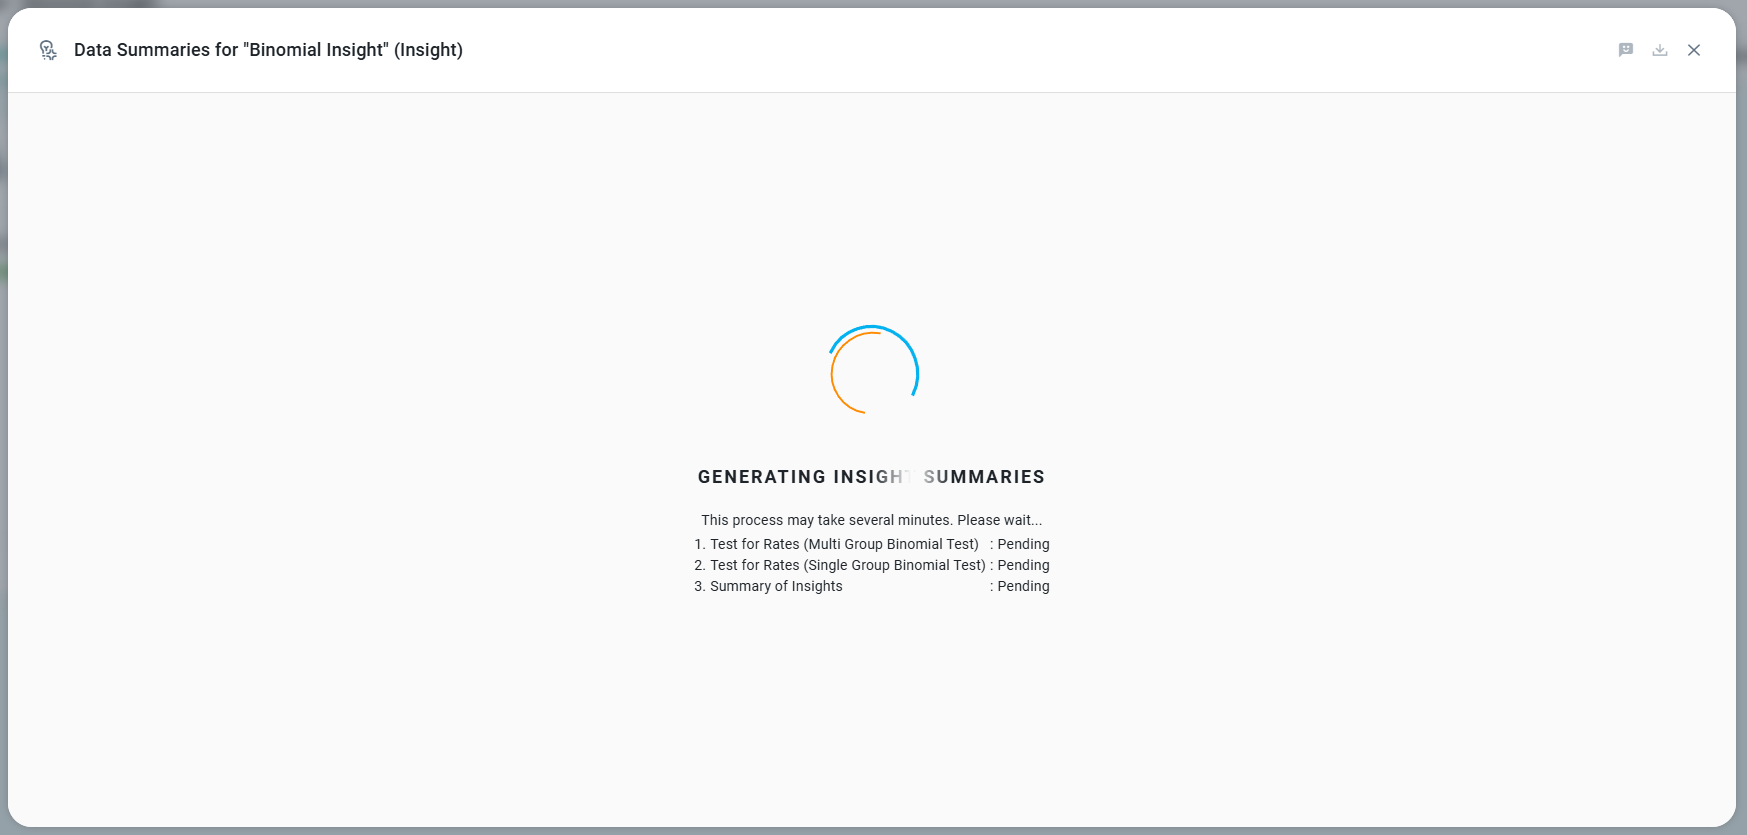
Once generated, a dialog will show the generated Insights Summaries.
-
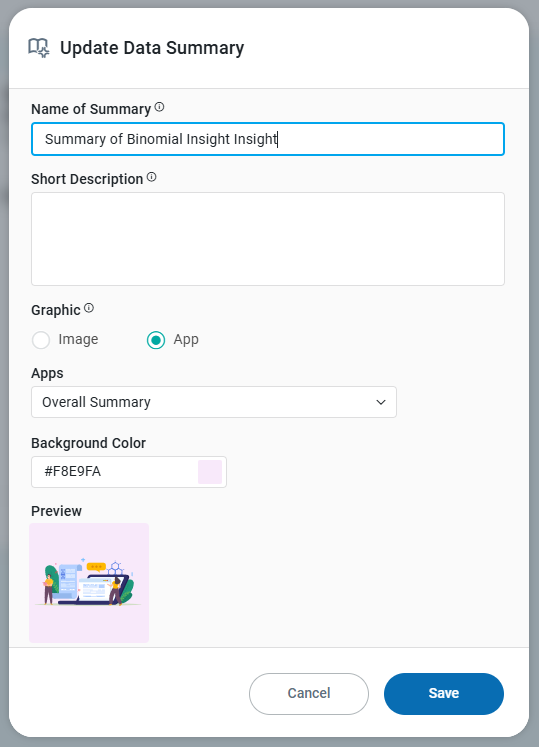
Add to Data Summary - opens a dialog to provide some additional configuration options before the Insights Summaries are added to the Data Summaries page in Easy Answers solution.
-
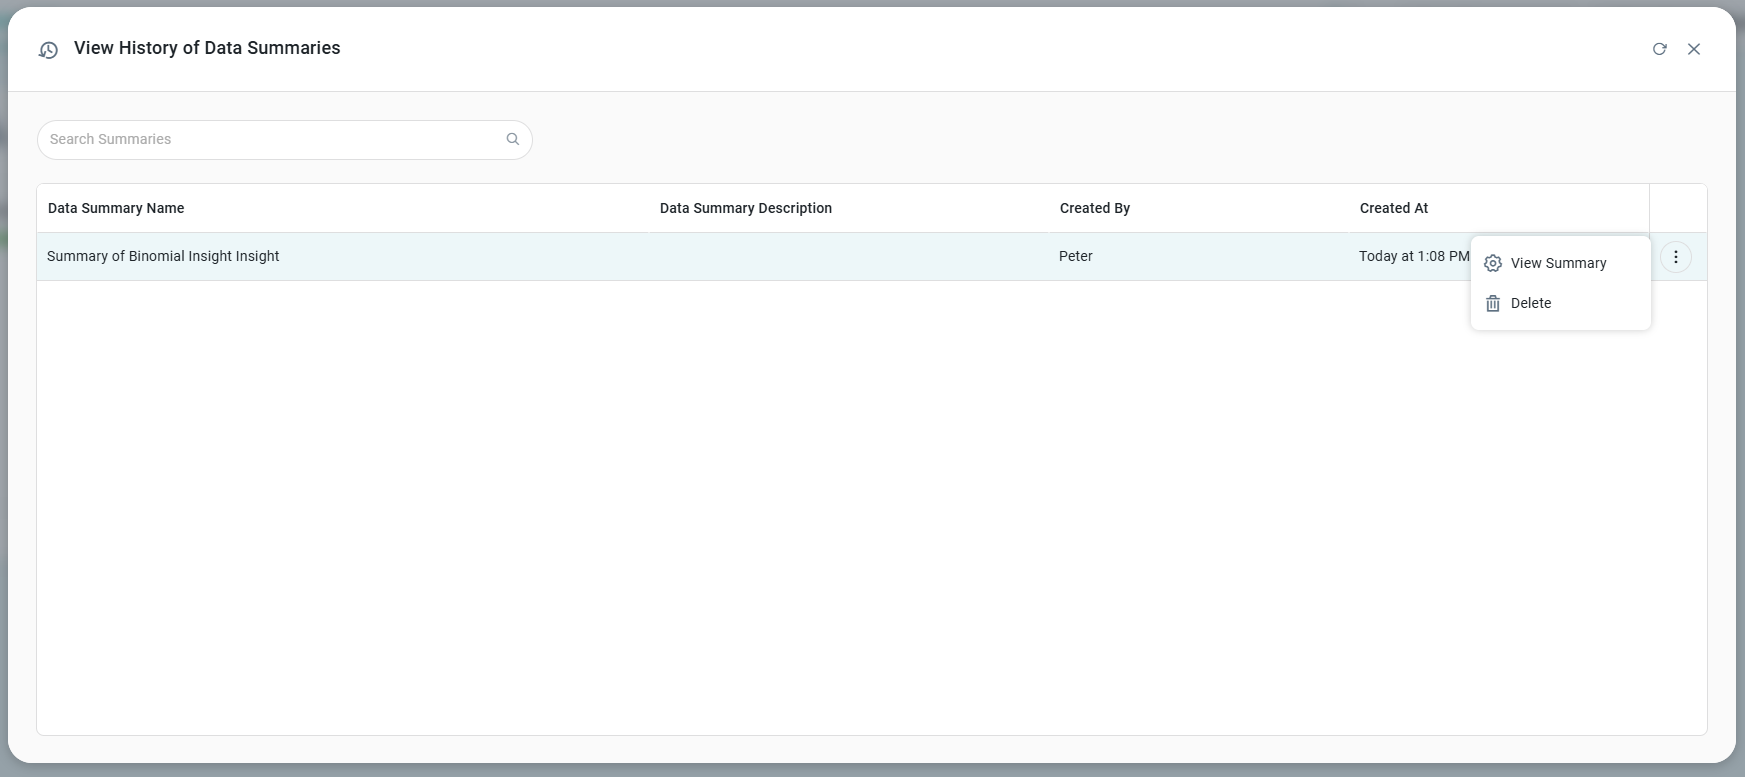
View History - opens a dialog to show a listing of all Summaries added to the Data Summaries page in Easy Answers.
-
Refresh - opens the same dialog as the Generate Summaries, but refreshes the existing Insight Summaries. Requires confirmation by user.
-
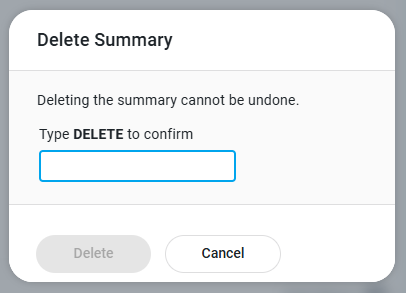
Delete - deletes the Insights Summaries generated after a confirmation dialog.
-
Lightbulb colors
-
Grey - Data Summaries have not yet been generated.
-
Green - Data Summaries have been generated successfully.
-
Orange - Data Summaries have been partially generated.
-
Red - Generation of Data Summaries has failed. The lightbulb icon will also show a “retry” decorator which allows the user to retry the request for the Data Summaries.
-
-
-
Filter - dropdown - select which type of Insights to show.
-
All Insights (Default) – The All Insights display all generated Quick Insights in the preview dialog.
-
Significant Insights – The Significant Insights display only the Quick Insights categorized as Significant.
-
Non-Significant Insights – The Non-Significant Insights display only the Quick Insights categorized as Non-Significant.
-
-
Add Insights to Feed Now - opens a dialog allowing the user to add all generated Quick Insights to the Insights Feed page in the Easy Answers solution. See Easy Answers - Insights Page.
Infographics Card Options
-
Full Story - opens a dialog allowing the user to view the details of the generated Quick Insight in full-screen.
-
Options menu
-
Add to Insights Feed - opens a dialog allowing the user to add the selected Infographic card for a given Quick Insight to the Insights Feed page in the Easy Answers solution. See Easy Answers - Insights Page.
-
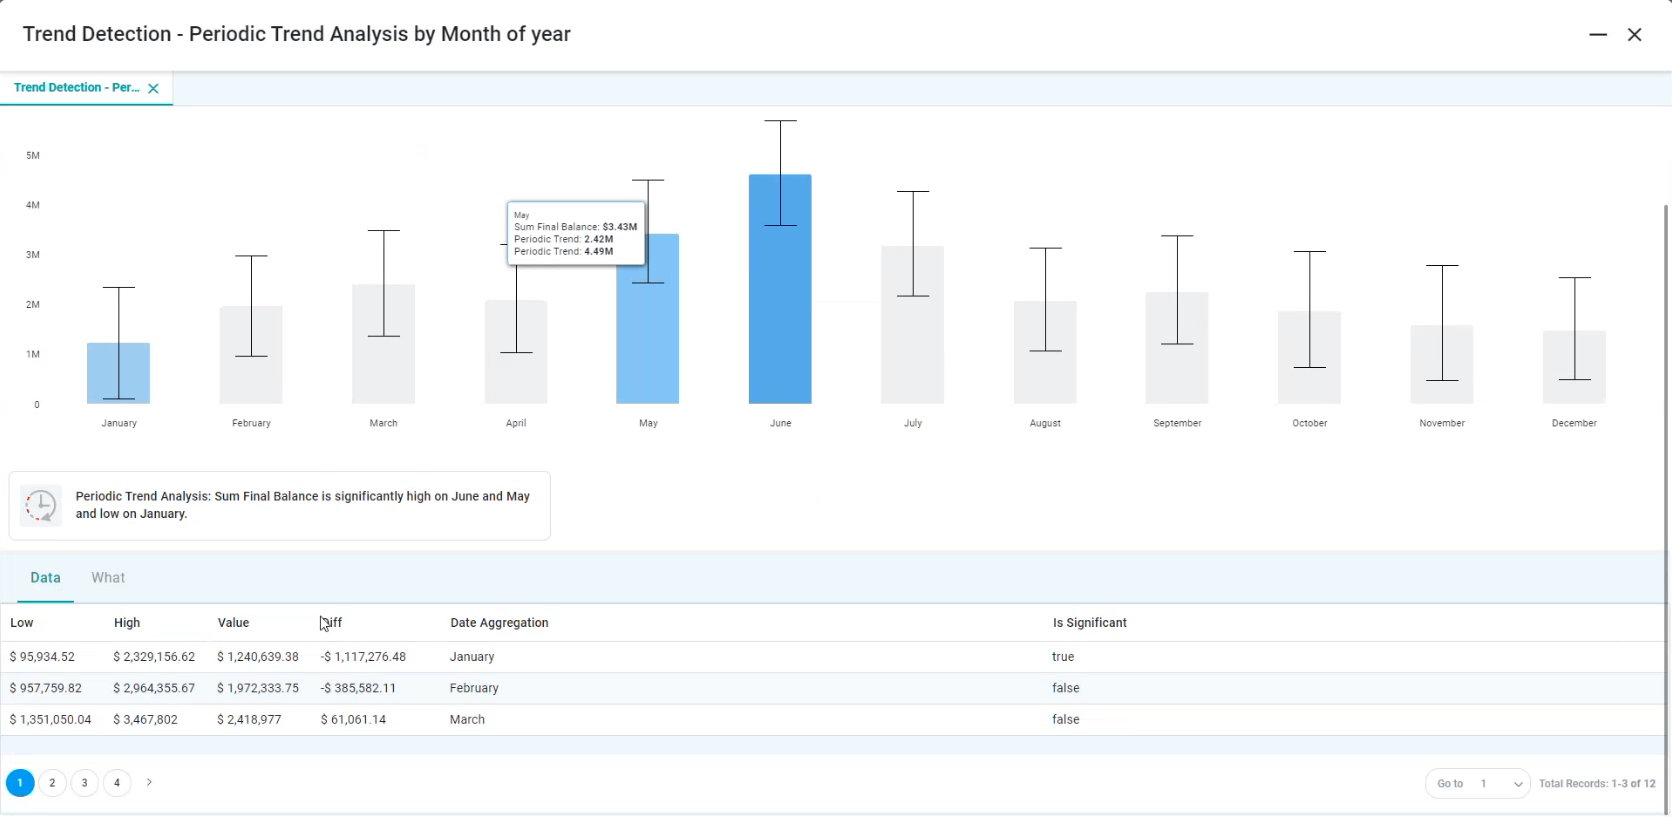
Full Story Dialog
-
Shows a detailed Chart, a Data tab with the data from the Chart, and a What tab with the input parameters from the configuration of the Quick Insight.
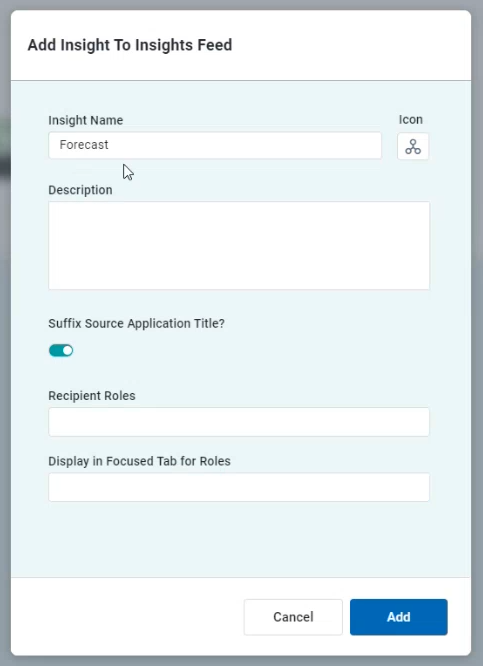
Add to Insights Feed dialog
-
The user can provide a more specific Insight Name, a short Description, add Suffix Source to Application Title, add Recipient Roles for the users who will receive the Quick Insights, a well as the Roles for the users who will be receiving the Quick Insights on the Focused tab. If no Roles are added to Display in Focused Tab for Roles, then all Recipient Roles will see the Quick Insights on the Other tab in Easy Answers.
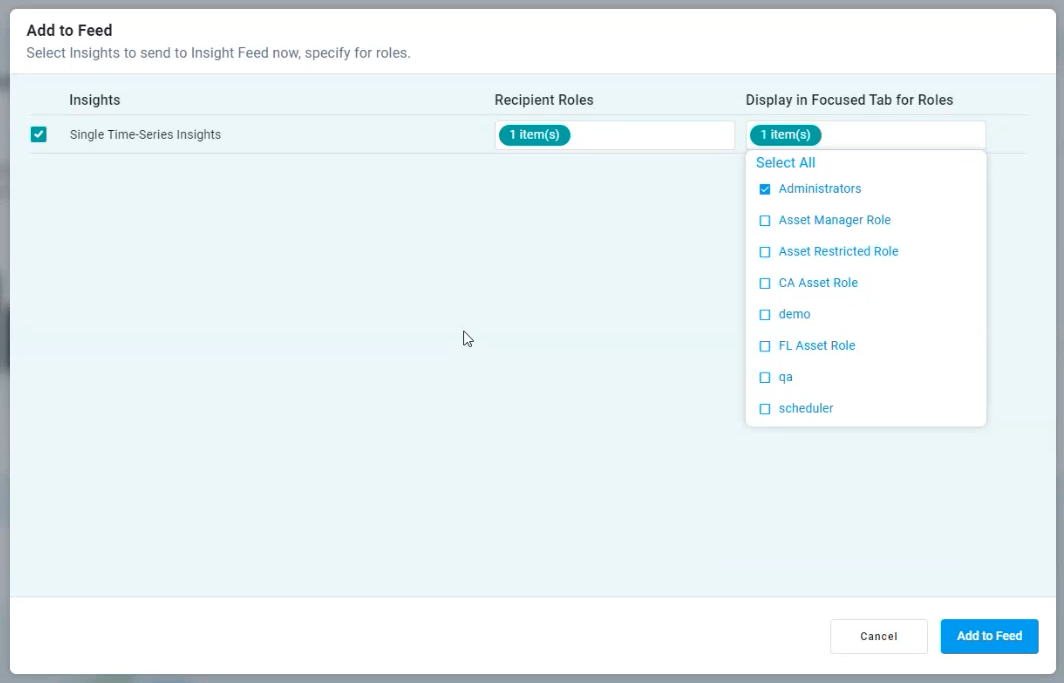
Add Insights to Feed Now dialog
-
The user can provide Recipient Roles for the users who will receive the Quick Insights, a well as the Roles for the users who will be receiving the Quick Insights on the Focused tab. If no Roles are added to Display in Focused Tab for Roles, then all Recipient Roles will see the Quick Insights on the Other tab in Easy Answers.
Contact App Orchid | Disclaimer